About the DIDI Index Indicator
The DIDI Index Forex Indicator for MT4 is a trend-following tool designed to capture directional strength by combining moving averages and momentum oscillators.
It’s built to filter out noise and highlight reliable market moves, producing clear signals via arrows, colored signals, or bands.
Whether you trade intraday, swing, or position styles, DIDI helps in identifying trend beginnings and pullbacks with greater clarity.
Trade idea
- Open a buy order as soon as the blue Didi Index signal line crosses the red line bottom-up.
- Open a sell order as soon as the red Didi Index signal line crosses the blue line bottom-up.
Free Download
Download the “didi-index.ex4” indicator for MT4
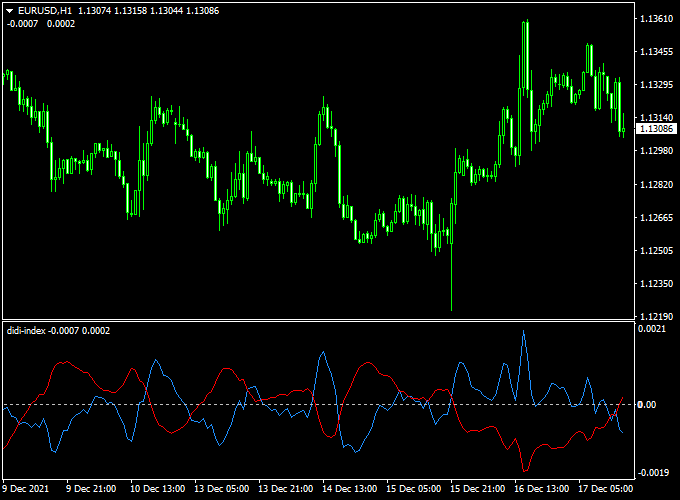
Indicator Example Chart (EUR/USD H1)
The example chart below displays the Didi Index MT4 indicator in action on the trading chart.

The Didi Index Renko Boxes MT4 Strategy
This strategy combines the Didi Index Forex Indicator with the Renko Boxes Forex Indicator to create a powerful and visually clear trading system.
The Renko Boxes filter out market noise, simplifying price action and highlighting clear trends, while the Didi Index acts as a momentum oscillator, providing the exact trigger for entries.
By removing time from the chart, Renko bars create a much smoother representation of the trend, allowing the Didi Index to give more reliable signals.
This system is ideal for traders who want to focus on clean price movements.
It is effective on any currency pair and is best used on a Renko chart with a box size of 5-15 pips. It is suitable for day trading and swing trading.
Buy Entry Rules
- A new Renko box forms in a bullish direction (e.g., a blue box), confirming an uptrend.
- The Didi Index indicator blue line crosses above its zero line, signaling bullish momentum.
- Stop Loss: Place it at the low of the previous two Renko boxes.
- Take Profit: Exit when a new Renko box forms in the opposite direction (a red box), or when the Didi Index blue line crosses back below the zero line.
Sell Entry Rules
- A new Renko box forms in a bearish direction (e.g., a red box), confirming a downtrend.
- The Didi Index indicator blue line crosses below its zero line, signaling bearish momentum.
- Stop Loss: Place it at the high of the previous two Renko boxes.
- Take Profit: Exit when a new Renko box forms in the opposite direction (a blue box), or when the Didi Index blue line crosses back above the zero line.
Advantages
- Noise Reduction: The Renko chart’s focus on price action simplifies the chart, filtering out choppy price movements and making trends much easier to identify and follow.
- Improved Signal Clarity: The Didi Index provides precise entry signals based on momentum, which are often more reliable when used in the context of a clean Renko trend.
- Discipline: This system encourages patience by making traders wait for a clear Renko trend and a confirming Didi Index signal before entering a trade.
Drawbacks
- Slow Signals: Because Renko charts are based on price movement, a signal might be delayed during periods of low volatility, causing a trader to miss a significant portion of a move.
- Box Size Importance: The strategy’s performance heavily depends on the Renko box size chosen. An incorrect size can lead to too many or too few signals.
Case Studies
Case Study 1: Buy Trade
On a Renko chart with a 10-pip box size, a series of five consecutive bullish (blue) boxes appeared, confirming a strong uptrend.
A brief pullback occurred, but the trend continued, and a new bullish box formed.
At the same time, the Didi Index blue line, which had dipped slightly, crossed back above the zero line.
A buy trade was entered. The price continued to climb for several more boxes, and the trade was exited for a nice profit when a red Renko box finally formed.
Case Study 2: Sell Trade
Using a 5-pip Renko chart, a strong downtrend developed, characterized by a long series of red boxes.
After a period of consolidation, a new red box formed, signaling a continuation of the downtrend.
The Didi Index blue line, which had been hovering near the zero line, crossed below it.
A sell trade was opened.
The price dropped sharply, and the position was held until a new blue Renko box formed, which served as a clear signal to exit the trade for a substantial profit.
Strategy Tips
- Box Size is Key: Experiment with different Renko box sizes on your preferred currency pair to find one that provides a balance between trend clarity and timely signals.
- Trend is Your Friend: Always trade in the direction of the established Renko trend. Do not try to pick tops or bottoms.
- Risk Management: Use a stop loss based on the Renko boxes, not a fixed number of pips, as the box size determines volatility.
- Combine with Candlestick Analysis: Even with Renko charts, observing price action patterns on a standard candlestick chart can provide additional confirmation and improve your entries and exits.
Download Now
Download the “didi-index.ex4” indicator for Metatrader 4
Indicator Specifications
| Specification | Details |
|---|---|
| Name | DIDI Index Forex Indicator |
| Platform | MetaTrader 4 (MT4) |
| Type | Moving Average Cross + Momentum Index + Signal Arrows |
| Timeframes | All supported; recommended for H1-H4 for swing, M15-H1 for intraday trades |
| Instruments | Forex pairs, indices, metals, crypto |
| Outputs | Colored histogram or index, cross arrows, optional alerts |
| Inputs |
|
| Included | Indicator file (.ex4), configuration guide & strategy notes |
FAQ — Practical & Strategy-Focused
1. Is DIDI Index reliable in ranging markets?
It is less reliable when the market is flat or choppy.
To improve: use momentum threshold (ensure histogram amplitude or ATR is above a minimum), and avoid trading against the trend on a higher timeframe.
2. How to avoid being stopped out prematurely?
Use volatility-based stop sizes (e.g., ATR) and avoid placing stop losses too close on small timeframes.
Consider waiting for the candle to close beyond the entry zone.
Using a higher timeframe structure support/resistance helps set stops more sensibly.
3. What timeframes give the best risk-reward with DIDI Index?
H1 is often balanced: enough movement vs noise. H4 or Daily for swing trades gives larger moves.
M15-H1 can work for intraday if your stops are tight and you have good entry confirmation.
Summary
The DIDI Index indicator is best when used with trend confirmation and momentum filters.
An effective strategy starts with identifying the overall trend on a higher timeframe, such as H4 or Daily.
Next, wait for the fast and slow moving averages to cross on the H1 chart. This shows alignment with the larger trend.
Confirm the setup by checking that the histogram momentum supports the move and that an arrow appears.
For entry, aim to take the trade on a pullback instead of chasing the first breakout. This reduces risk and improves reward potential.
Place your stop just beyond the most recent swing high or low. Manage profits by taking partials at key levels and trailing your stop as structure develops.


