About the Fibonacci Support & Resistance Indicator for MT4
The Fibonacci Support & Resistance Indicator for MetaTrader 4 automatically plots key support and resistance zones on the trading chart.
These zones serve as high-probability areas for price reversals, breakouts, or continuation moves.
By combining Fibonacci logic with price structure, this indicator helps traders identify strategic entry and exit points more effectively.
Main Features
- Auto-detection of swing highs and lows
- Overlay of support and resistance zones
- Works on all timeframes (M1 to D1)
- Non-repainting and beginner-friendly
Trade idea
- For a buy trade, take profit around the R1, R2, and R3 resistance levels.
- For a sell trade, take profit around the S1, S2, and S3 support levels.
The Fibo Support & Resistance indicator can be used for both entry and exit signals or to confirm buy & sell trade setups issued by your favorite trading systems or strategies.
Free Download
Download the “cFibo Level.ex4” indicator for MT4
Benefits
- Quickly identify high-confluence trade zones
- Improve entry timing and stop-loss placement
- Adaptable to breakout or reversal strategies
- Supports all major Forex pairs, indices, and gold
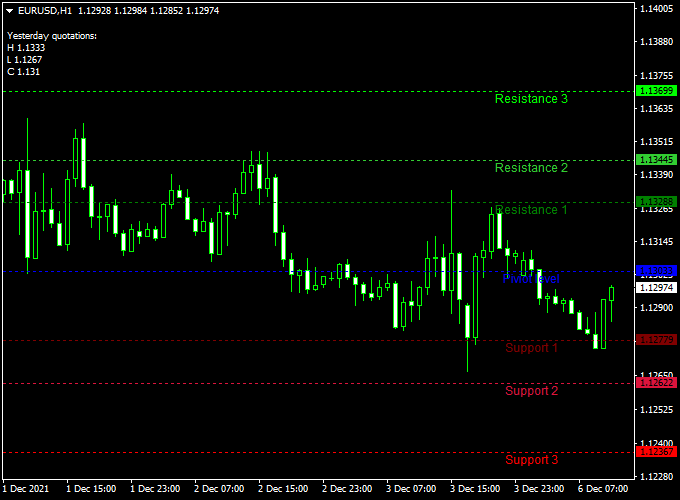
Indicator Example Chart (EUR/USD H1)
The example below highlights how the Fibo Support & Resistance MT4 indicator identifies key levels directly on the trading chart.

How to Trade Using This Indicator
Buy Setup
- Wait for the price to approach a Fibonacci support zone
- Look for confirmation from a bullish candlestick pattern
- Enter a long position when the pattern closes within or just above the support zone
- Set stop-loss just below the zone
- Target the next resistance level or Fibonacci extension level
Sell Setup
- Wait for the price to reach a Fibonacci resistance zone
- Look for confirmation via a bearish reversal pattern
- Enter a short position on confirmation
- Place a stop-loss above the resistance zone
- Target the next support level or 50% retracement
Pros
- Simple to use and interpret
- Works on any currency pair and timeframe
- Non-repainting zones for reliable decision-making
Cons
- Does not generate alerts
- Best used with a second confirmation indicator
MT4 Scalping Strategy Using Fibo Support & Resistance + Super Scalper Indicator
This strategy combines the structural precision of the Fibo Support & Resistance Indicator with the fast signal generation of the Super Scalper Indicator.
The idea is to use the Fibo levels and support/resistance zones as areas of interest, and wait for Super Scalper signals for precise entries.
What is This Strategy About?
This is a confluence-based scalping strategy designed for short-term trades, where the trader waits for the price to enter a support/resistance zone and confirms the entry with a Super Scalper signal.
The strategy is ideal for 1-minute to 15-minute charts on volatile pairs.
Buy Rules
- Use the Fibo Support & Resistance indicator to find a strong support zone
- Wait for the price to enter the zone on the 1M or 5M chart
- Confirm a Super Scalper buy signal inside the zone (blue line)
- Enter long trade
- Stop-loss: 8–12 pips below the zone
- Take-profit: 15–30 pips depending on volatility and next resistance level
Sell Rules
- Use the Fibo Support & Resistance indicator to locate a resistance zone
- Switch to the 1M or 5M chart
- Confirm a Super Scalper sell signal inside the resistance zone (yellow line)
- Enter short trade
- Stop-loss: 8–12 pips above the zone
- Take-profit: 15–30 pips, or next support level
Case Study 1: GBP/USD M5 Chart Analysis (Sample Period)
- Total Signals: 62 trades
- Winning Trades: 40 (64.5%)
- Average Win: +18 pips
- Average Loss: -9 pips
- Net Result: +477 pips over the test period
Case Study 2: EUR/JPY M15 Chart Analysis (Sample Period)
- Total Signals: 36 trades
- Winning Trades: 24 (66.7%)
- Average Win: +28 pips
- Average Loss: -12 pips
- Net Result: +492 pips over the test period
Advantages
- High confluence strategy with clear visual zones and signal triggers
- Works well in volatile market conditions
- Scalable to multiple pairs and sessions
Drawbacks
- Requires quick decision-making and fast execution
- Signals can be frequent on small timeframes, may lead to overtrading
Strategy Conclusion and Tips
This strategy is ideal for traders looking for fast entries and quick exits around major Fibonacci zones.
It provides structure with the Fibo Support & Resistance tool and timely entries via Super Scalper.
Always confirm with price action patterns and avoid trading during low-liquidity times.
Indicator Specifications
| Indicator Name | Fibo Support & Resistance |
|---|---|
| Platform | MetaTrader 4 |
| File Type | .ex4 |
| Timeframes | All (M1–D1) |
| Currency Pairs | All Forex pairs, Gold, and Indices |
| Repaint | No |
| Alerts | No built-in alerts |
| Inputs | Automatic, no manual input required |
| Installation | Place in MQL4/Indicators folder and restart MT4 |
FAQ
Can this indicator be used on any pair?
Yes, it works on all currency pairs, gold, indices, and other CFDs supported by MT4.
Does the indicator repaint?
No, the zones and levels are static once plotted and do not repaint.
Do I need to adjust settings?
No, the indicator works with default settings and requires no input tweaking.
Can I use it with other indicators?
Absolutely. It pairs well with momentum indicators, price action, or custom signal tools like Super Scalper.
Final Words
The Fibo Support & Resistance Indicator is a reliable tool to add to your MT4 toolbox.
Combined with the Super Scalper, it forms a precise scalping strategy that delivers consistent results when used with discipline.


