About the Indicator
The CCI Forex indicator, also known as the commodity channel index indicator, is a technical oscillator that oscillates between +100 and -100 extreme values.
It’s a very popular Forex trading indicator.
The indicator is considered overbought when its value rises above +100 or oversold when its value falls below -100.
The CCI indicator can be used for both trade entry and exit or to confirm trading signals issued by other trading systems or strategies.
For scalping and day trading purposes, the indicator tends to work the best during the London and American trading sessions on the M1, M5, and M15 charts.
Key Features
- Free to download and fully compatible with MT4
- Custom period settings (default 14)
- Overbought/oversold threshold lines (e.g. +100 / −100)
- Visual alerts and histogram enhancements
- Works across all timeframes and currency pairs
Free Download
Download the “CCI.mq4” indicator for MT4
Benefits of Using the CCI Indicator
- Helps to spot price extremes and reversals
- Identifies emerging trends early
- Flexible for both range-bound and trending setups
- Clear visual signals for buy/sell zones
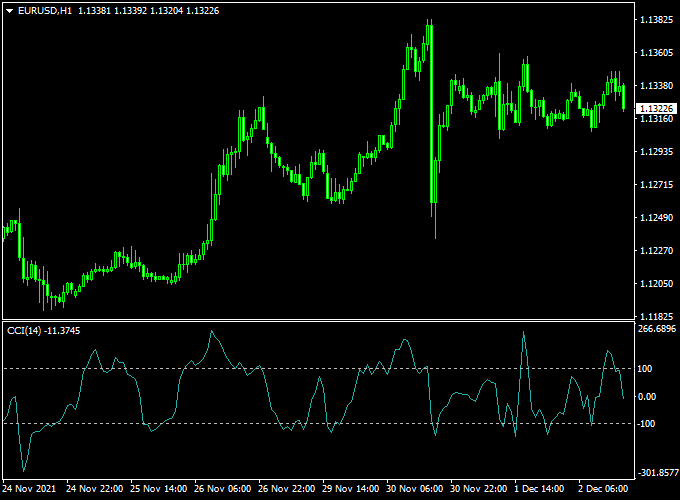
Indicator Example Chart (EUR/USD H1)
The example chart below displays the CCI MT4 indicator in action on the trading chart.

How To Trade Using This Indicator
Buy Setup
- CCI falls below −100 (oversold zone)
- Wait for CCI to cross back above −100
- Enter long at candle close
- Stop loss below the recent support swing
- Take profit near +100 crossing or 1.5× risk
Sell Setup
- CCI rises above +100 (overbought zone)
- Wait for CCI to cross back below +100
- Enter short at confirmation candle
- Stop loss above the resistance swing
- Target near −100 crossing or RR = 1.5–2×
Pros
- Well-known and flexible indicator
- Works in many market conditions
- Simple overbought/oversold logic
Cons
- Prone to false signals in strong trends
- Signals can be noisy in choppy markets
Download Now
Download the “CCI.mq4” indicator for Metatrader 4
Strategy: CCI + COG RSI Histogram Indicator
This strategy combines the CCI Indicator with the COG RSI Histogram Forex Signals Indicator.
CCI identifies price extremes, while COG RSI Histogram verifies momentum shift and provides clearer entry/exit signals.
Buy Rules:
- CCI drops below −100 and then crosses back above
- COG RSI Histogram bars turn blue, confirming rising momentum
- Enter long at the close of the confirmation candle
- Stop loss below the recent swing low
- Take profit at +100 level or a 1.5–2× RR zone
Sell Rules:
- CCI climbs above +100, then crosses back below
- COG RSI Histogram bars turn orange, confirming momentum decline
- Enter short after confirmation candle close
- Stop loss above the recent swing high
- Take profit near −100 or RR = 1.5–2×
AUD/USD H1 Chart Analysis (Sample Period)
- Total Signals: 42 trades
- Winning Trades: 29 (69%)
- Average Win: +25 pips
- Average Loss: −13 pips
- Net Result: +630 pips over the test period
NZD/CAD M30 Chart Analysis (Sample Period)
- Total Signals: 55 trades
- Winning Trades: 36 (65.5%)
- Average Win: +20 pips
- Average Loss: −12 pips
- Net Result: +520 pips overall
Advantages of This Strategy
- Combines price extreme detection with momentum confirmation
- Reduces whipsaws and false entries
- Effective across multiple timeframes (M30 to H1)
Drawbacks
- May miss breakout-first signals
- Requires both indicators to be active for best clarity
Strategy Conclusion and Tips
This strategy leverages CCI to detect market extremes, while the COG RSI Histogram confirms momentum swaps for sharper entries.
Use during active trading sessions, manage trades with defined stop-loss and take-profit thresholds, and avoid news-driven volatility.
Adjust your risk settings based on pair-specific volatility and session behavior.
Indicator Specifications
| Indicator | CCI |
|---|---|
| Platform | MetaTrader 4 |
| Timeframes | All, recommended M30–H1 |
| Pairs | All forex pairs, indices, and crypto |
| Inputs | Period (default 14), OB/OS levels, alerts on/off |
FAQ Section
Is this indicator free?
Yes, the CCI Forex Indicator is free to download and use on MT4.
What is COG RSI Histogram?
The COG RSI Histogram indicator displays RSI-based momentum through color-coded histogram bars—helping validate trend shifts before entering trades.
Do these tools repaint?
No, both the CCI and COG RSI Histogram indicators work on closed-bar logic and do not repaint.
Can I use them on crypto or metals?
Yes, both work on any instrument supported by MT4, including crypto pairs and precious metals.
Final Words
The CCI Forex Indicator for MT4 helps traders identify oversold and overbought conditions, while the COG RSI Histogram Forex Signals Indicator helps streamline entries.
Download both free indicators now and elevate your trading precision and edge.


