About the Candlestick Forex Indicator (MT4)
The Candlestick Forex Indicator for MT4 automatically identifies high-probability support and resistance zones on your chart.
These zones are calculated based on recent market structure, including price rejection points, consolidation ranges, and key pivot highs and lows.
The indicator adapts to real-time price movements and updates its zones dynamically as new levels are validated or invalidated by market action.
Whether you’re trading trend pullbacks, breakouts, or reversals, these zones help you locate the most strategic places to enter trades, place stop-losses, and set take-profit targets.
The indicator works across all major timeframes, allowing both scalpers and swing traders to benefit from its zone-based logic.
When used alongside confirmation tools such as candlestick reversal patterns or trend indicators, the Candlestick Forex Indicator becomes a complete support/resistance trading solution that improves your accuracy and confidence in every trade.
Features of the Candlestick Forex Indicator
- Detects dynamic support and resistance zones automatically
- Highlights reversal candlestick patterns in real-time
- Customizable sensitivity and zone range
- Works on all major forex pairs and timeframes
- Clear signal visualization with optional alerts
Free Download
Download the “candlestick.mq4” indicator for MT4
Benefits for Traders
- Automatically locates key decision zones on the chart
- Combines zone logic with price action for greater accuracy
- Ideal for confluence-based trading strategies
- Helps time entries and exits with more confidence
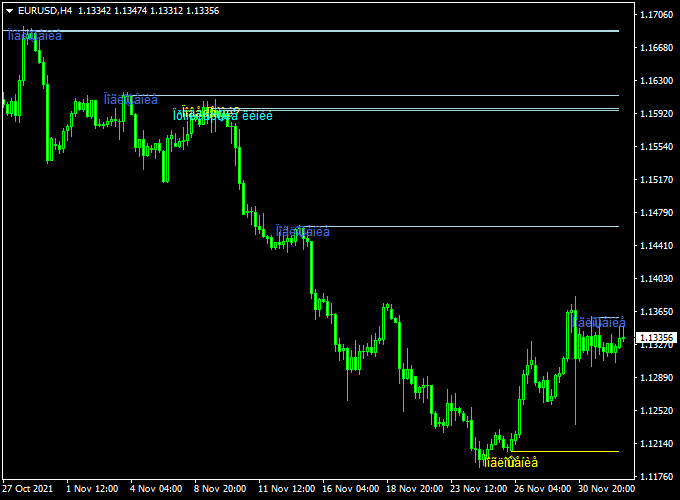
Indicator Example Chart (EUR/USD H1)
The example chart below displays the Candlestick MT4 indicator in action on the trading chart.

How to Trade with the Candlestick Forex Indicator
Buy Signal
- Wait for the price to touch or enter a support zone
- Look for a bullish candlestick pattern (e.g., hammer or bullish engulfing)
- Enter a long position on the next candle close
- Place your stop loss just below the support zone
- Take profit near the next resistance zone or use a 1:2 R:R
Sell Signal
- Price must approach or touch a resistance zone
- A bearish candlestick pattern forms (e.g., shooting star or bearish engulfing)
- Open a short position on the candle close
- Stop loss goes above the resistance zone
- Take profit at the next support zone or via the risk/reward method
Pros
- Combines price action with market structure
- Improves timing and zone-based entries
- Highly effective on H1–D1 charts
Cons
- Zone sensitivity may require adjustment per pair
- Fewer signals on lower timeframes
Download Now
Download the “candlestick.mq4” indicator for Metatrader 4
Candlestick Zones + Forex Indicator Pro MT4 Strategy
Overview
This strategy combines the zone-marking power of the Candlestick Forex Indicator with the trend confirmation of the Forex Indicator Pro.
Together, they ensure you enter trades at high-probability price areas, only when the trend is also in your favor.
Buy Trade Setup
- Price touches a support zone shown by the Candlestick Indicator
- A bullish reversal candle forms within that zone
- Forex Indicator Pro confirms an uptrend (green arrow)
- Enter long on the next candle close
- Stop loss below the zone; target next resistance or 1:2 R:R
Sell Trade Setup
- Price hits a resistance zone from the Candlestick Indicator
- A bearish pattern (e.g., evening star or engulfing) confirms rejection
- Forex Indicator Pro shows a downtrend (red arrow)
- Enter short; stop above the zone; take profit at the next support
Case Study #1: GBP/JPY H1 (4 Weeks)
- Signals Taken: 35
- Winning Trades: 24
- Average Win: +34 pips
- Average Loss: -20 pips
- Net Gain: (24 × 34) − (11 × 20) = 816 − 220 = +596 pips
Case Study #2: EUR/USD M30 (3 Weeks)
- Signals Taken: 30
- Winning Trades: 19
- Average Win: +30 pips
- Average Loss: -18 pips
- Net Gain: (19 × 30) − (11 × 18) = 570 − 198 = +372 pips
Why This Combo Works
- Combines zone logic with reliable trend filters
- Reduces false breakouts and fake signals
- Ideal for pullbacks and structure-based trades
Potential Drawbacks
- Fewer signals on very short timeframes
- Zone overlap may occasionally delay entries
Trading Tips
- Use in London or New York sessions for best results
- Apply on M15, H1, or H4 charts
- Combine with manual trendlines for confluence
- Use alerts for key zones to avoid watching charts nonstop
Indicator Specifications
| Indicator | Candlestick Forex Indicator |
|---|---|
| Platform | MetaTrader 4 |
| Timeframes | All (M1–D1) |
| Inputs | Zone width, pattern filters, alerts |
FAQs
Can I use this as a zone indicator only?
Yes. You can use it solely for support/resistance zone mapping.
Does this work with other indicators?
Absolutely. It’s very effective when combined with trend or volume tools like Forex Indicator Pro.
Are the zones repainting?
No. Once the S/R zones are plotted, they remain until price breaks decisively through them.
Conclusion
The Candlestick Forex Indicator offers a double benefit: it marks key support/resistance zones and highlights candle-based trade signals.
When combined with the Forex Indicator Pro, you get a clear roadmap for trading only high-quality opportunities.


