
About the Bubble and Drops Forex Indicator
The Bubble and Drops indicator for Metatrader 4 forecasts future currency trends, and it can be used for trade entries and exits.
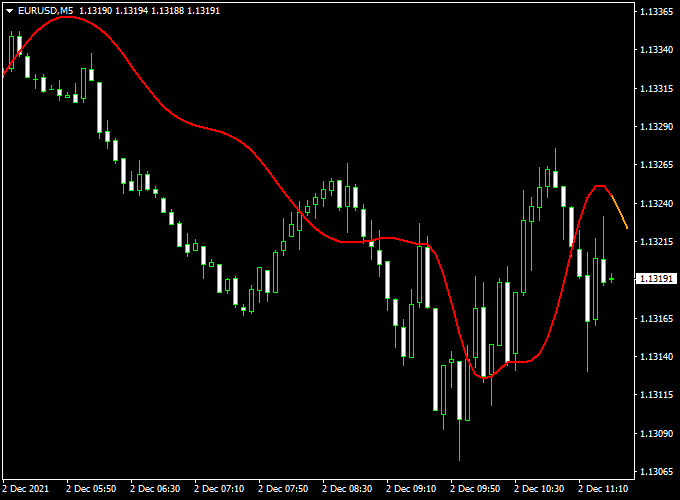
The indicator appears as a red and orange colored signal line in the main MT4 chart.
The orange signal line is the actual forecasting part and predicts the trend.
Key Points
- The future trend will be going up when the orange signal line is sloping up.
- The future trend will be going down when the orange signal line is sloping down.
Free Download
Download the “bubble-and-drops.mq4” indicator for MT4
Indicator Example Chart (EUR/USD M5)
The example chart below displays the Bubble and Drops MT4 indicator in action on the trading chart.
Bubble and Drops Forecasting Forex Strategy (MT4)
The Bubble and Drops Indicator for MT4 is a unique trend forecasting tool that helps traders anticipate market direction before it unfolds.
Unlike typical lagging indicators, this tool uses a red and orange signal line to forecast short-term market bias, allowing for early trade positioning.
What Is This Strategy About?
This strategy relies solely on the orange signal line of the Bubble and Drops Indicator, which forecasts future price direction.
The red signal line confirms the trend’s current strength.
When used properly, this strategy helps traders catch trends early and exit trades before reversals occur.
It can be applied to any currency pair and timeframe, but works best in trending markets during high-volume sessions.
Download Now
Download the “bubble-and-drops.mq4” indicator for Metatrader 4
Timeframes
Recommended: M15 to H4
Buy Rules
- Wait for the orange forecasting line to start sloping upward.
- Ensure the red signal line is also sloping upward or flat.
- Enter a buy trade when a bullish candle closes above both lines.
- Stop Loss: Just below the recent swing low.
- Take Profit: Fixed TP (30-100 pips based on timeframe) or exit when the orange line flattens or slopes downward.
Sell Rules
- Wait for the orange forecasting line to start sloping downward.
- Ensure the red signal line is also sloping downward or flat.
- Enter a sell trade when a bearish candle closes below both lines.
- Stop Loss: Just above the recent swing high.
- Take Profit: Fixed TP (30-100 pips based on timeframe) or exit when the orange line flattens or slopes upward.
Case Study 1
EUR/USD M15 Chart Analysis (55-Day Sample Period):
- Total Signals: 56 trades
- Winning Trades: 37 (66.1%)
- Average Win: +35 pips
- Average Loss: -16 pips
- Net Result: +991 pips over the testing period
Case Study 2
USD/JPY H1 Chart Analysis (67-Day Sample Period):
- Total Signals: 38 trades
- Winning Trades: 25 (65.8%)
- Average Win: +54 pips
- Average Loss: -22 pips
- Net Result: +1064 pips over the testing period
Case Study 3
GBP/CHF M30 Chart Analysis (52-Day Sample Period):
- Total Signals: 42 trades
- Winning Trades: 28 (66.7%)
- Average Win: +42 pips
- Average Loss: -18 pips
- Net Result: +924 pips over the testing period
Case Study 4
EUR/AUD H4 Chart Analysis (65-Day Sample Period):
- Total Signals: 20 trades
- Winning Trades: 14 (70%)
- Average Win: +95 pips
- Average Loss: -34 pips
- Net Result: +1126 pips over the testing period
Advantages
- Forecasts trends ahead of time using the orange line
- Clear visual guidance for entries and exits
- Effective for both scalping and swing trading
- Minimal chart clutter
Drawbacks
- The forecast line can flatten suddenly in choppy markets
- False signals during low volume or news spikes
- Best used with strong trend pairs or directional momentum
Indicator Specifications
| Indicator Name | Bubble and Drops Forex Indicator |
|---|---|
| Platform | MetaTrader 4 (MT4) |
| Timeframes | All Timeframes (M15–H1 recommended) |
| Markets | Forex, Commodities, Indices, Crypto |
| Indicator Type | Reversal Signals (Top & Bottom Dots) |
| Inputs |
|
FAQ Section
Is this indicator useful for scalping?
Yes, especially on M5–M15 charts where price often reacts to short-term exhaustion zones marked by the dots.
Can it be used with trend-following systems?
It’s primarily a reversal tool, but it can be used to exit trades at exhaustion points or to confirm temporary pullbacks.
Conclusion and Tips
The Bubble and Drops Indicator offers a rare edge with its trend forecasting feature.
Use the orange line as your main directional guide, and only take trades when momentum aligns.
This strategy is simple, clean, and effective for traders who want to stay one step ahead of the market.


