About the Indicator
The ADR SL No Line Forex Indicator for MT4 provides a minimalistic and effective solution for determining stop-loss and take-profit levels based on the Average Daily Range (ADR).
Unlike traditional ADR indicators, this version doesn’t draw lines on your chart, keeping your chart clean while still giving you key trading levels through simple panel data.
Key Features
- Displays dynamic SL/TP values based on the current ADR
- No chart clutter – no lines drawn
- Ideal for traders who use ADR as a volatility filter
- Helps you calculate more accurate risk-reward ratios
- Easy to use and works on all timeframes
How It Works
The indicator calculates the ADR over a configurable period (usually 5 to 20 days) and then outputs suggested stop-loss and target distances relative to the current price.
It does not draw any visual elements on the chart itself.
All data is neatly displayed in a panel for easy access.
This allows traders to quickly gauge how far the price is likely to move during the session and plan their trades accordingly.
Free Download
Download the “adr-sl-noline-indicator.mq4” indicator for MT4
Benefits of Using the Indicator
- Improves stop-loss accuracy using market volatility
- Eliminates messy chart overlays
- Better position sizing with volatility-adjusted levels
- Helps you avoid trades with insufficient room to run
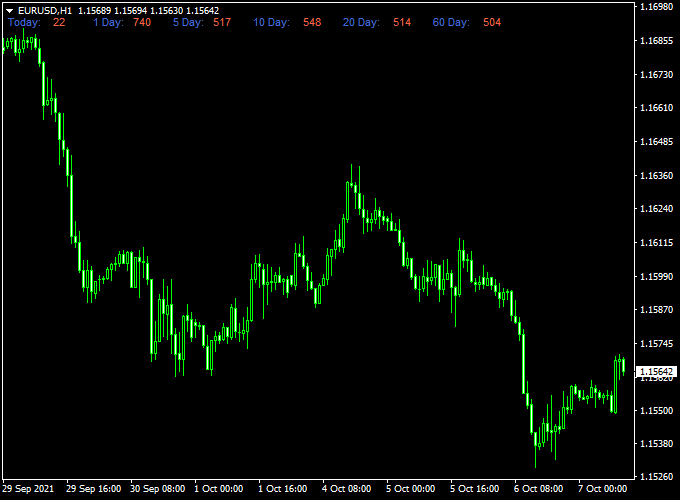
Indicator Example Chart (EUR/USD H1)

How To Trade Using This Indicator
Buy Setup
- Check the panel to see today’s ADR and current range
- If the current range is significantly below ADR, look for buy setups
- Use the suggested ADR-based SL and TP from the panel
- Enter long with SL just below the suggested stop value and TP near the ADR range
Sell Setup
- Check the panel to confirm the available ADR room
- If the price hasn’t reached the full ADR range, look for sell opportunities
- Place a stop loss and a target using the suggested panel data
Note: Best used with candlestick patterns, moving average confirmations, or trend indicators for signal confirmation.
Download Now
Download the “adr-sl-noline-indicator.mq4” indicator for Metatrader 4
ADR SL + RSI Peak Valley Forex Strategy for MT4
This strategy combines two powerful tools, the ADR SL No Line Forex Indicator and the RSI Peak Valley Levels Indicator, to help traders identify high-probability trade setups with calculated stop loss logic and momentum-based entry points.
It’s ideal for intraday traders looking to capture strong directional moves without relying on visual clutter.
The system uses Average Daily Range (ADR) data for volatility-based SL planning and RSI peak/valley zones for precise reversals or continuation trades.
What Is This Strategy About?
The ADR SL No Line Indicator provides important data such as the average daily range and recommended stop loss distance, without drawing additional lines on the chart.
This helps you size trades accurately based on volatility.
The RSI Peak Valley Levels Indicator, on the other hand, highlights extreme RSI levels, indicating price exhaustion and potential reversal zones.
When you combine RSI exhaustion zones with ADR-based risk management, you get a clean, data-driven trading system with clearly defined risk parameters.
Buy Rules
Conditions:
- The RSI Peak Valley Indicator shows a bullish reversal (price is at or near a valley zone).
- The current price has room to move within the ADR range (not near the upper ADR boundary).
Entry:
Open a buy trade when the RSI hits a key valley level and price shows a bounce or bullish confirmation candle. Ensure there is at least 30–50% of the ADR left for the day, suggesting enough room for the price to move in your favor.
Stop Loss:
Use the ADR SL No Line Indicator’s recommended SL value. This SL is based on the asset’s average daily volatility, protecting without being too tight.
Take Profit:
Target 1:1.5 or 1:2 risk-to-reward, or close the trade when the RSI reaches a peak level or the ADR upper range is approached.
Sell Rules
Conditions:
- The RSI Peak Valley Indicator shows a bearish reversal (price is near a peak zone).
- The current price is not too close to the lower ADR boundary.
Entry:
Enter a short position when RSI hits a peak and price begins to reject higher levels. Make sure there is enough space left within the ADR range for a meaningful move.
Stop Loss:
Use the ADR SL No Line Indicator’s suggested SL value for proper volatility-based risk management.
Take Profit:
Set a take profit target of 1:2 risk-to-reward, or exit the trade when RSI hits a valley level or price approaches the lower ADR boundary.
Advantages
- Combines momentum exhaustion with volatility-aware trade planning.
- Clean chart setup—no clutter, only data-driven decision-making.
- Adjusts automatically to market volatility for better risk control.
- Works on all major pairs and intraday timeframes (M15, M30, H1).
Drawbacks
- Requires discipline to wait for both RSI and ADR conditions to align.
- Performance may vary in extremely low or high volatility conditions.
- Not ideal during major news events when ADR values are unstable.
Conclusion
The ADR SL + RSI Peak Valley Strategy is designed for traders who want precise entries and calculated exits.
The ADR SL No Line Indicator provides professional-level SL sizing, while the RSI Peak Valley Indicator identifies powerful reversal zones.
Together, they form a system that is both clean and powerful, ideal for disciplined forex traders.
Examples, Case Data, Back Test, Pros & Cons
Pros
- No visual clutter – clean trading environment
- Helps filter out trades with poor risk-reward
- Simple yet powerful ADR-based trade planning
Cons
- No visual lines may be a downside for some traders
- Not a signal generator – must be combined with your strategy
Indicator Specifications
| Indicator Name | ADR SL No Line |
|---|---|
| Platform | MetaTrader 4 (MT4) |
| Timeframes | All timeframes |
| Pairs | All forex pairs, indices, and crypto assets |
| Type | Volatility Measurement / Risk Management |
| Inputs |
|
Final Words
The ADR SL No Line Indicator is perfect for traders who want to manage their trades based on market volatility without overcrowding their charts.
It simplifies risk management while preserving a clean visual setup.
Combine it with price action or trend-following systems to create a complete ADR-based strategy.


