The Wilder’s DMI Signals Histogram Forex indicator for Metatrader 4 is solely based on the DMI indicator and provides buy & sell signals on the chart.
The indicator does all the hard work for you and transforms the DMI trading method into solid buy & sell signal arrows.
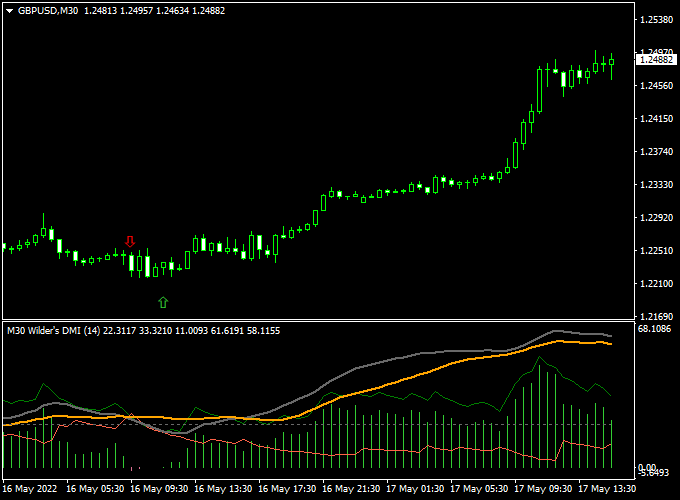
After you have downloaded and installed the indicator on the MT4 trading platform, it should look like the image shown below.
Key Features
- Based on the DMI technical indicator
- Follows the trend
- Good for entry & exit points
- Well worth adding to your indicator collection
This indicator can work together with any existing trading strategy or system as a trend confirmation tool.
Free Download
Download the “Wilders dmi histogram.mq4” MT4 indicator
Example Chart
The GBP/USD 30-minute chart below shows Wilder’s DMI Signals Histogram technical indicator in action.

Basic Trading Signals From Wilder’s DMI
BUY:
- Open a buy position when the green Wilder’s DMI signals arrow gets printed on the chart.
- Place a stop loss below the previous swing low price.
- Exit the buy trade for a predetermined profit target or wait for a sell signal.
SELL:
- Open a sell position when the red Wilder’s DMI signals arrow gets printed on the chart.
- Place a stop loss above the previous swing high price.
- Exit the sell trade for a predetermined profit target or wait for a buy signal.
Download Now
Download the “Wilders dmi histogram.mq4” MT4 indicator
Wilder’s DMI + Forex Gump Indicator Strategy
This strategy combines the trend strength analysis of Wilder’s DMI Signals Histogram Indicator with the multi-timeframe signal precision of the Forex Gump Indicator.
Together, they offer high-confidence trade signals and help filter out choppy or false entries.
How the Indicators Work Together
- Wilder’s DMI Histogram measures the strength and direction of the trend using the Directional Movement Index (DMI). When the histogram bars are green and rising, the bullish trend is strengthening; red and falling indicate bearish strength.
- Forex Gump generates real-time buy/sell signals based on price action and volatility, making it ideal for fast entries during strong market moves.
Recommended Settings
- Timeframes: M15, M30, H1
- Pairs: EUR/USD, GBP/USD, USD/CAD, AUD/JPY
Buy Setup
- Wait for the Wilder’s DMI Histogram to show green bars increasing in height.
- Confirm a Buy signal from the Forex Gump Indicator (typically a green arrow or buy message).
- Enter a buy position immediately after both signals align.
- Place a stop loss below the recent swing low or previous Gump signal line.
- Set your take profit at 1.5x to 2x the risk or exit when DMI bars turn red.
Sell Setup
- Wait for the Wilder’s DMI Histogram to show red bars increasing in height.
- Confirm a Sell signal from the Forex Gump Indicator (typically a red arrow or sell message).
- Enter a sell position after both indicators agree.
- Place a stop loss above the recent swing high or previous resistance level.
- Set your take profit at 1.5x to 2x the risk or exit when DMI bars turn green.
Strategy Pro Tips
- Use this strategy during high-volume sessions like London or New York for better accuracy.
- Do not trade against strong DMI momentum, even if Forex Gump signals appear.
- Combine this strategy with support and resistance levels for additional confirmation.
Adjustable Parameters & Settings
Time frame, DMI length, show ZDX, show ADXR, level, alerts, show arrows, colors, style
More Info About This Indicator
Currency Pairs: works on any currency pair
Trading Platform: developed for Metatrader 4 (MT4)
Time Frames: any
Indicator Type: trend
Final Thoughts
The Wilders DMI Signals Histogram Indicator for MetaTrader 4 offers a streamlined approach to trend analysis by converting the Directional Movement Index (DMI) into clear buy and sell signals.
Its visual representation through histogram bars simplifies the identification of market trends, making it accessible for traders at all levels.
When combined with complementary tools like the Forex Gump Indicator, it enhances the accuracy of trade entries and exits.
This synergy helps in filtering out market noise and focusing on high-confidence setups.
While the indicator is versatile across various currency pairs and timeframes, it’s advisable to test it on a demo account to tailor its settings to your specific trading strategy.
By doing so, traders can effectively leverage the Wilders DMI Signals Histogram Indicator to make informed and timely trading decisions.


