
About the Advanced Bollinger Band Squeeze Indicator
The Advanced Bollinger Band Squeeze Indicator for MT4 is a highly effective tool for identifying breakout setups before they happen.
It combines Bollinger Bands and Keltner Channels to detect squeeze conditions, moments when the market is in low volatility and building pressure for a potential explosive move.
This indicator visually highlights squeeze zones on your chart so you can anticipate powerful trend changes or reversals with precision.
Key Points
- The Bollinger Band Squeeze indicator above the 0.00 level is considered bullish.
- The Bollinger Band Squeeze indicator below the 0.00 level is considered bearish.
- Works great for scalping and day trading.
- Super simple technical indicator.
Free Download
Download the “bollinger-squeeze-advanced.mq4” indicator for MT4
Key Features
- Combines Bollinger Bands and Keltner Channel analysis
- Plots squeeze areas directly on your chart (with color-coded bars)
- Non-repainting, real-time detection of volatility compression
- Works on all timeframes and currency pairs
- Ideal for breakout traders and volatility-based systems
Benefits of Using This Indicator
- Helps identify explosive moves before they start
- Avoids entering during dead or sideways markets
- Simple visual confirmation of volatility shifts
- Can be combined with momentum indicators for directional bias
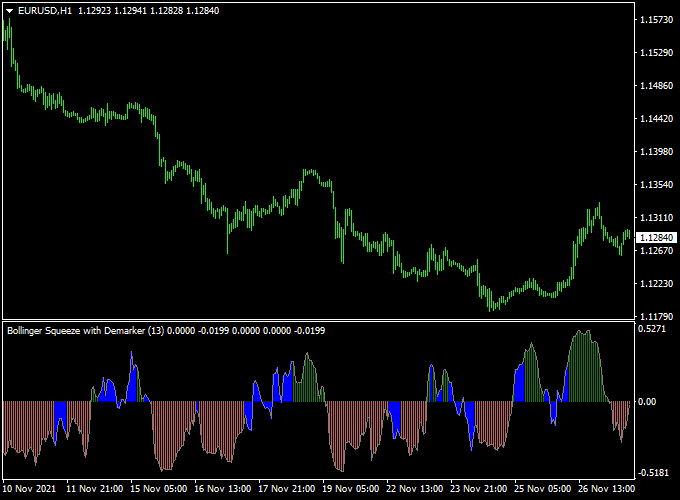
Indicator Example Chart (EUR/USD H1)
The example chart below displays the Advanced Bollinger Band Squeeze indicator in action on the trading chart.
How To Trade Using This Indicator
- Buy signal: Open a buy trade as soon as the Advanced Bollinger Band Squeeze histogram crosses the 0.00 level bottom-up.
- Sell signal: Open a sell trade as soon as the Advanced Bollinger Band Squeeze histogram crosses the 0.00 level top-down.
- Stop loss: Above or below the most recent swing high/low point
- Take profit: Based on risk-reward ratio (1:2 or 1:3), ATR, or trailing stop method.
Case Data
- Timeframe: M30, H1, H4 recommended
- Currency Pairs: All Forex pairs
- Market Sessions: Works well during London and NY session overlaps
Download Now
Download the “bollinger-squeeze-advanced.mq4” indicator for Metatrader 4
Advanced Bollinger Band Squeeze + Flat Trend RSI Strategy (MT4)
This strategy combines the Advanced Bollinger Band Squeeze Indicator with the Flat Trend RSI Indicator to create a powerful method for detecting breakout opportunities with confirmed momentum.
The Bollinger Band Squeeze identifies low volatility periods primed for strong moves, while the Flat Trend RSI filters out false signals by measuring trend strength and momentum.
This dual-indicator strategy is designed to capture clean breakouts on M15 to H1 timeframes with reliable entry and exit points.
What is This Strategy About?
The Advanced Bollinger Band Squeeze indicator detects when Bollinger Bands contract tightly, signaling that volatility is low and a breakout is likely imminent.
The Flat Trend RSI indicator analyzes momentum to confirm if the breakout direction has strength.
When both indicators align, traders can enter trades with higher confidence, capitalizing on fresh trend developments rather than false breakouts or choppy price action.
Buy Rules
- Wait for the Bollinger Band Squeeze indicator to signal a squeeze breakout to the upside, moving above the zero level.
- Confirm that the Flat Trend RSI is colored blue, indicating bullish momentum.
- Enter a buy trade once both conditions are met.
- Place a stop-loss below the recent swing low or below the lower Bollinger Band.
- Set a take profit target at the next resistance level or use a trailing stop as the trend progresses.
Sell Rules
- Wait for the Bollinger Band Squeeze indicator to signal a squeeze breakout to the downside, moving below the zero level.
- Confirm that the Flat Trend RSI is colored red, indicating bearish momentum.
- Enter a sell trade once both indicators confirm the downtrend.
- Set a stop-loss above the recent swing high or above the upper Bollinger Band.
- Target the next support level or use a trailing stop to lock in profits.
Case Study 1
USD/JPY M5 Chart Analysis (34-Day Sample Period):
- Total Signals: 62 trades
- Winning Trades: 41 (66.1%)
- Average Win: +31 pips
- Average Loss: -14 pips
- Net Result: +977 pips over the testing period
Case Study 2
EUR/USD H1 Chart Analysis (42-Day Sample Period):
- Total Signals: 28 trades
- Winning Trades: 18 (64.3%)
- Average Win: +73 pips
- Average Loss: -30 pips
- Net Result: +1014 pips over the testing period
Advantages
- Effectively detects volatility contractions and confirms momentum to reduce false breakouts.
- Clear buy and sell signals with well-defined entry and exit rules.
- Works well on multiple forex pairs and popular timeframes (M15 to H1).
- Helps traders stay aligned with emerging trends.
Drawbacks
- Performance may degrade in choppy, sideways markets.
- Patience is needed during prolonged squeeze periods without a breakout.
- Stop-loss placement can be challenging in highly volatile environments.
Use this strategy during active market hours, especially during London and New York sessions, for the best results.
Avoid trading during major news events that can cause erratic price spikes.
Indicator Specifications
| Indicator Name | Advanced Bollinger Band Squeeze |
|---|---|
| Platform | MetaTrader 4 |
| Timeframes | M30, H1, H4, Daily |
| Trading Pairs | All Forex, Gold, and Indices |
| Repainting | No |
| Inputs |
|
Final Words
The Advanced Bollinger Band Squeeze Indicator for MT4 is an essential breakout detection tool.
It gives you an early alert during market compression, so you can prepare to enter right before volatility expands.
Combine it with momentum tools and price structure for the best trading results.


