
About the AG Renko Chart Indicator
The AG Renko Chart Indicator for MT4 is a trend-following tool that converts standard price action into a streamlined Renko-based line.
By focusing purely on price movement rather than time, it filters out market noise and provides a distinct bias for any currency pair.
A blue line signifies a bullish trend, while a red line signals a bearish phase.
This indicator is essential for traders who want to identify the core market direction without the distractions of traditional candlestick volatility.
Free Download
Download the “ag-renko-chart.mq4” MT4 indicator
Key Features
- The indicator generates non-repainting buy and sell signals based on Renko price logic.
- It features a dual-color line system for instant identification of the prevailing trend.
- It simplifies complex price action into a single, smooth line for better decision-making.
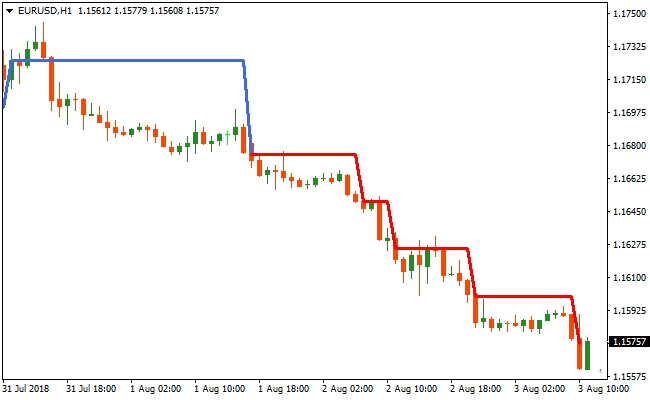
Indicator Chart
The chart displays the AG Renko Chart Indicator as a color-coded line overlaid on price action.
You can see the blue line highlighting a sustained upward move, while the red line indicates a clear transition into a sell-side market.
Guide to Trade with AG Renko Chart Indicator
Buy Rules
- Wait for the AG Renko Chart Indicator to change its color from red to blue.
- Confirm the blue line is moving in an upward trajectory.
- Open a buy order at the start of the next price candle after the blue signal appears.
Sell Rules
- Wait for the AG Renko Chart Indicator to change its color from blue to red.
- Confirm the red line is moving in a downward trajectory.
- Open a sell order at the start of the next price candle after the red signal appears.
Stop Loss
- For buy trades, place the stop loss below the most recent swing low or the previous red line segment.
- For sell trades, place the stop loss above the most recent swing high or the previous blue line segment.
Take Profit
- Exit the trade immediately when the AG Renko Chart Indicator prints an opposite color signal.
- Use a trailing stop behind the colored line to capture maximum gains during long trends.
- Consider closing a portion of the position at major horizontal support or resistance levels.
AG Renko Chart and Trend Predictor Forex Scalping Strategy for MT4
This MT4 scalping strategy combines the trend clarity of the AG Renko Chart Metatrader 4 Forex Indicator with the precise entry arrows of the Trend Predictor V1.0 Forex Indicator MT4.
The AG Renko Chart helps you read the market’s underlying trend using colored lines where blue shows bullish structure and red shows bearish structure.
The Trend Predictor adds timely entry cues with blue arrows for buying opportunities and red arrows for selling opportunities.
By combining these two indicators, scalpers can focus on high probability setups where both trend and entry direction are aligned.
This strategy works well on M1, M5, and M15 timeframes.
It is ideal for traders who want clear, fast entries and exits without complex rules.
The trend filter ensures you trade in the right direction while the entry arrows help you time your positions for short term moves.
Buy Entry Rules
- The AG Renko Chart line is blue, indicating a bullish trend.
- The Trend Predictor Indicator displays a blue arrow, signaling a buy entry.
- Enter a buy trade at the close of the candle with the blue arrow while the AG Renko Chart remains blue.
- Place the stop loss a few pips below the recent swing low or the latest minor Renko pullback low.
- Set a take profit target of 8 to 20 pips on M1, 15 to 35 pips on M5, and 30 to 50 pips on M15 or near the next resistance zone.
Sell Entry Rules
- The AG Renko Chart line is red, indicating a bearish trend.
- The Trend Predictor Indicator displays a red arrow, signaling a sell entry.
- Enter a sell trade at the close of the candle with the red arrow while the AG Renko Chart remains red.
- Place the stop loss a few pips above the recent swing high or the latest minor Renko pullback high.
- Set a take profit target of 8 to 20 pips on M1, 15 to 35 pips on M5, and 30 to 50 pips on M15 or near the next support zone.
Advantages
- Combines trend direction with timed entry signals for higher probability scalping setups.
- Works across multiple short timeframes, making it versatile for scalpers.
- Simple rules reduce guesswork and improve consistency.
- Clear blue and red visuals make it easy to identify the trend and entry direction quickly.
- Helps avoid entries against the underlying trend, improving overall win rate.
Drawbacks
- In fast news driven volatility, entries can trigger prematurely and require quick exits.
- Smaller timeframes may generate more false arrows during choppy conditions.
- Requires strict discipline to exit when trend or signal conditions reverse.
Case Study 1 – EURUSD M5
On EURUSD in an M5 chart session, the AG Renko Chart turned blue indicating a bullish trend.
Shortly after, the Trend Predictor Indicator showed a blue arrow.
A buy trade was entered at the close of the signal candle with the stop loss placed a few pips below the recent Renko pullback low.
The price continued upwards and hit a 30 pip take profit target within the next 12 minutes.
Case Study 2 – GBPUSD M15
During a London session on GBPUSD M15, the AG Renko Chart remained red confirming bearish pressure.
A red arrow appeared on the Trend Predictor Indicator.
A sell position was opened at the close of the signal candle with the stop loss just above the recent swing high.
Price extended lower and reached a 45 pip take profit near the next support level.
Strategy Tips
- Only take trades where the AG Renko Chart trend color matches the Trend Predictor arrow color to filter low probability signals.
- Adjust take profit targets based on the timeframe you trade: smaller targets on M1 and slightly larger targets on M5 and M15.
- Place stop losses just beyond the nearby swing structure instead of arbitrary fixed pip amounts to reflect true market action.
- Monitor spread cost, especially on M1 and M5 since wider spreads can reduce net profits on tight scalping targets.
Download Now
Download the “ag-renko-chart.mq4” Metatrader 4 indicator
FAQ
How does the AG Renko Chart Indicator differ from standard Renko bricks?
While traditional Renko bricks are plotted on a separate offline chart, the AG Renko Chart Indicator displays its findings directly on your standard MT4 activity chart.
This allows you to combine Renko-based logic with your existing candlestick patterns and technical analysis tools without switching windows.
What is the best way to avoid false signals in a ranging market?
The indicator is most effective in trending environments.
To filter out false signals during a sideways market, only take trades that align with a higher timeframe trend.
For example, only take blue signals on the M15 chart if the H1 chart also shows a bullish bias.
Summary
The AG Renko Chart Indicator is a robust solution for traders looking to simplify their chart and follow the path of least resistance.
Its primary benefit is the clarity it provides during volatile market sessions, helping you stay in profitable trades longer while avoiding premature exits.
By focusing on price action through a Renko lens, it removes the emotional stress of watching every minor candle fluctuation.
Integrating this tool into your strategy can significantly improve your ability to capture sustained market moves with confidence.


