
About the Array Simple Moving Average Indicator
The Array Simple Moving Average indicator for MT4 provides straightforward trading signals based on the crossover of two simple moving averages.
This classic approach helps Forex traders identify bullish and bearish market conditions quickly.
The system uses a fast and a slow moving average with adjustable period settings.
When the fast MA crosses above the slow MA, it signals a potential buy opportunity.
Conversely, when the fast MA crosses below the slow MA, it signals a potential sell opportunity.
The indicator’s periods can be customized to suit different trading strategies and timeframes.
Traders often combine the Array SMA indicator with other technical analysis tools or trend filters to enhance signal reliability.
Free Download
Download the “array-test-indicator.mq4” MT4 indicator
Key Features
- Generates buy and sell signals based on SMA crossovers.
- Includes fast and slow moving averages with adjustable periods.
- Supports multiple timeframes and currency pairs.
- Simple visual signals make trade decisions easier.
- Can be combined with other indicators for improved accuracy.
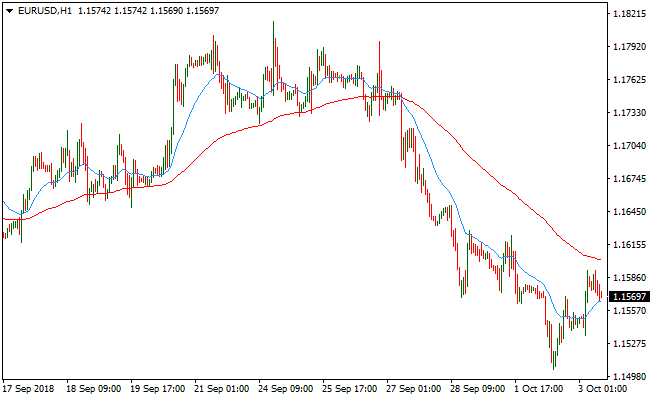
Indicator Chart
The Array SMA indicator chart displays a fast (blue) and slow (red) moving average.
Crossovers between these lines indicate potential buy or sell trades.
This helps Forex traders quickly spot entry points and trade in line with the trend.
Guide to Trade with the Array Simple Moving Average Indicator
Buy Rules
- Wait for the blue line (fast MA) to cross above the red line (slow MA).
- Confirm that the overall trend is bullish.
- Enter a buy trade at the crossover confirmation.
- Ignore signals that go against the trend.
Sell Rules
- Wait for the red line (slow MA) to cross above the blue line (fast MA).
- Confirm that the overall trend is bearish.
- Enter a sell trade at the crossover confirmation.
- Ignore signals that go against the trend.
Stop Loss
- For buy trades, place the stop-loss below the most recent swing low or support level.
- For sell trades, place the stop-loss above the most recent swing high or resistance level.
- Adjust the stop distance according to volatility and timeframe.
Take Profit
- Close buy trades when the crossover reverses or an opposite signal appears.
- Close sell trades when the crossover reverses or an opposite signal appears.
- Optional partial exits can be taken at key support/resistance levels.
Array SMA + ASC Trend MT4 Day Trading Strategy
This MT4 day trading strategy combines the Array Simple Moving Average MT4 indicator and the ASC Trend MT4 indicator.
The Array SMA uses two signal lines: a blue line and a red line.
A bullish trend is identified when the blue line crosses above the red line from below, while a bearish trend occurs when the red line crosses above the blue line from below.
The ASC Trend indicator provides buy and sell signals with blue arrows for bullish entries and magenta arrows for bearish entries.
This strategy is designed for day trading on M15 and H1 charts and works best on major currency pairs with clear intraday trends.
Buy Entry Rules
- The blue signal line of the Array SMA crosses above the red signal line from below, indicating a bullish trend.
- The ASC Trend indicator displays a blue arrow, confirming the buy signal.
- Enter a long trade immediately after the blue arrow appears with trend confirmation.
- Place stop loss below the most recent swing low or below the crossover point of the SMA lines.
- Take profit at the next resistance level or set a 2:1 reward-to-risk ratio.
- Alternatively, use a trailing stop while the blue arrow remains and the SMA lines indicate a bullish trend.
Sell Entry Rules
- The red signal line of the Array SMA crosses above the blue line from below, indicating a bearish trend.
- The ASC Trend indicator displays a magenta arrow, confirming the sell signal.
- Enter a short trade immediately after the magenta arrow appears with trend confirmation.
- Place a stop loss above the most recent swing high or above the SMA crossover point.
- Take profit at the next support level or set a 2:1 reward-to-risk ratio.
- Alternatively, trail stop while the magenta arrow remains and the SMA lines indicate a bearish trend.
Advantages
- Combines trend confirmation and precise entry signals to improve accuracy.
- Clear entry and exit rules based on SMA crossovers and arrow signals.
- Adaptable for multiple major pairs, including EURUSD, GBPUSD, USDJPY, and AUDUSD.
- Effective for day trading on M15 and H1 charts.
- Reduces the risk of entering counter-trend trades by confirming both indicators.
Drawbacks
- Less effective in sideways markets with frequent SMA line crossovers causing false signals.
- Requires patience for proper alignment of the SMA crossover and ASC Trend arrow.
- Day trading requires active monitoring and fast execution to capture optimal pip movement.
- High frequency of signals on shorter time frames may lead to overtrading.
Example Case Study 1 (EURUSD M15 bullish trade)
On EURUSD M15, the blue SMA line crossed above the red line, indicating a bullish trend.
The ASC Trend indicator displayed a blue arrow at 1.1050.
A long trade was entered immediately. Stop loss was placed at 1.1035, 15 pips below.
Price moved to 1.1090, capturing 40 pips before partial profit was taken.
The blue SMA remained above the red line and the bullish trend continued, allowing an additional 20 pips gain.
Example Case Study 2 (GBPUSD H1 bearish trade)
On GBPUSD H1, the red SMA line crossed above the blue line, indicating a bearish trend.
The ASC Trend indicator displayed a magenta arrow at 1.2655.
A short trade was entered at 1.2654. Stop loss was placed at 1.2670, 16 pips above.
Price declined to 1.2605, capturing 49 pips profit.
The red SMA remained above the blue line and the magenta arrow continued to signal bearish momentum.
Strategy Tips
- Focus on trading during active market hours when liquidity and volatility are high for better day trading results.
- Wait for both the SMA crossover and ASC Trend arrow to align before entering to reduce false signals.
- Monitor support and resistance levels to improve entry and exit points.
- Use a trailing stop to secure profits as the trend continues.
- Use proper position sizing to manage risk on each trade according to your account size.
- Consider combining with a higher time frame trend analysis to filter trades in the direction of overall market bias.
- Be patient and avoid chasing trades if signals do not perfectly align on the chosen time frame.
Download Now
Download the “array-test-indicator.mq4” Metatrader 4 indicator
FAQ
Can the moving average periods be customized?
Yes, traders can adjust both the fast and slow MA periods in the input settings to match their preferred trading style and timeframe.
Is additional confirmation recommended?
While it can be used alone, combining the SMA crossover with trend indicators or price action improves reliability and reduces false signals.
How should trades be exited?
Trades can be closed when an opposite crossover occurs or according to a personal exit strategy based on support/resistance or profit targets.
Summary
The Array Simple Moving Average indicator for MT4 provides clear crossover signals that help traders identify potential buy and sell opportunities.
Its fast and slow moving averages make trend detection straightforward and actionable.
This indicator is ideal for traders who want a classic, easy-to-read system for trading crossovers.
It works across multiple timeframes and currency pairs, providing consistent signals when used with proper trend confirmation.
With trend-aligned entries, the Array SMA indicator can help traders improve trade timing, reduce false signals, and maintain consistent trading performance.


