
About the Auto Fibonacci Trading Zones Indicator
The Auto Fibonacci Trading Zones indicator for MT4 automatically plots two key trading zones alongside important Fibonacci levels on the chart.
It helps traders quickly identify overbought and oversold areas, making it easier to plan entries and exits based on market conditions.
The indicator uses a blue zone to mark support and a red zone to mark resistance.
Traders typically look for buy opportunities in the blue zone when the overall trend is upward, and sell opportunities in the red zone when the trend is downward.
The colors and appearance of the zones can be customized in the indicator’s settings.
These zones make it easier to spot areas where price is likely to react.
Combining this indicator with trend filters or other technical tools improves signal reliability, allowing traders to focus on entries that align with the overall market direction.
Free Download
Download the “autofibo-trading-zones.mq4” MT4 indicator
Key Features
- Automatically plots blue support and red resistance trading zones.
- Displays key Fibonacci levels within the zones.
- Helps identify overbought and oversold market conditions.
- Supports trend-aligned trade decisions for buy and sell entries.
- Customizable zone colors and display settings.
Indicator Chart
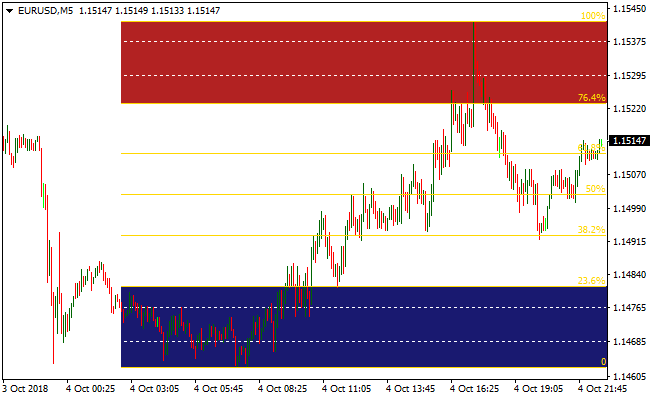
The Auto Fibonacci Trading Zones indicator chart shows price interacting with blue and red trading zones.
Blue zones highlight potential buying areas in an uptrend, while red zones highlight potential selling areas in a downtrend.
Traders can combine these zones with other tools for more reliable entries.
Guide to Trade with Auto Fibonacci Trading Zones Indicator
Buy Rules
- Confirm the overall market trend is upward.
- Wait for the price to reach the blue buy zone.
- Use additional technical tools to confirm bullish conditions.
- Enter a buy trade when confirmation aligns with the zone.
Sell Rules
- Confirm the overall market trend is downward.
- Wait for the price to reach the red sell zone.
- Use additional technical tools to confirm bearish conditions.
- Enter a sell trade when confirmation aligns with the zone.
Stop Loss
- For buy trades, place the stop loss just below the blue support zone.
- For sell trades, place the stop loss just above the red resistance zone.
- Adjust the stop distance to match volatility and timeframe.
Take Profit
- Close buy trades when price reaches the red sell zone or the opposite signal occurs.
- Close sell trades when price reaches the blue buy zone or the opposite signal occurs.
- Alternatively, use personal trade exit methods for scaling out.
Auto Fibonacci Trading Zones + German Sniper MT4 Strategy
This MT4 strategy combines the Auto Fibonacci Trading Zones MT4 indicator and the German Sniper MT4 indicator.
The Auto Fibonacci indicator identifies blue trading zones as support and red trading zones as resistance.
Traders look for buy opportunities in the blue zones when the market trend is upward and sell opportunities in red zones when the trend is downward.
The German Sniper indicator provides precise entry signals using the “SMART BUY” yellow line for buy trades and the “SMART SELL” yellow line for sell trades.
This strategy works best on M15 and H1 charts and is suitable for swing or short-term traders.
Buy Entry Rules
- Price is within or near the blue Fibonacci trading zone, which acts as support.
- The overall market trend is upward, as identified by price action or higher time frame analysis.
- The German Sniper indicator displays the “SMART BUY” yellow line.
- Enter a buy trade after the confirmation candle closes above or near the support zone.
- Place a stop loss below the blue trading zone or below the most recent swing low.
- Take profit near the next red Fibonacci trading zone (resistance) or use a fixed reward-to-risk ratio.
- Or trail stop while price stays above support and the German Sniper signal remains active.
Sell Entry Rules
- Price is within or near the red Fibonacci trading zone, which acts as resistance.
- The overall market trend is downward.
- The German Sniper indicator displays the “SMART SELL” yellow line.
- Enter a sell trade after the confirmation candle closes below or near the resistance zone.
- Set stop loss above the red trading zone or above the recent swing high.
- Take profit near the next blue Fibonacci trading zone (support) or use a fixed reward-to-risk ratio.
- Or trail stop while price stays below resistance and the German Sniper signal remains active.
Advantages
- Combines dynamic support and resistance zones with precise entry signals.
- Reduces false entries by requiring both zone confirmation and German Sniper signal alignment.
- Adaptable to multiple pairs including EURUSD, GBPUSD, AUDJPY, and USDCHF.
- Clear trade management using defined zones for stop loss and take profit.
Drawbacks
- In ranging markets, signals may trigger within zones without significant follow-through.
- Requires patience to wait for German Sniper confirmation in the correct zone.
- May produce fewer trades since both zone and indicator must align.
Example Case Study 1 (EURUSD H1 bullish trade)
On EURUSD H1, price retraced to the blue Fibonacci trading zone near 1.1000.
The overall trend was upward. The German Sniper indicator displayed a “SMART BUY” yellow line.
A confirmation candle closed above the support zone and a buy trade was entered at 1.1005.
Stop loss was placed at 1.0980, 25 pips below.
Price rallied to the next red zone near 1.1060, capturing 55 pips before partial profit was taken.
The German Sniper signal remained active and the trend continued higher.
Example Case Study 2 (GBPJPY M15 bearish trade)
On GBPJPY M15, price reached the red Fibonacci trading zone at 155.50.
The overall trend was downward. The German Sniper indicator displayed the “SMART SELL” yellow line.
A confirmation candle closed below the resistance zone and a sell trade was entered at 155.48.
Stop loss was set at 155.75, 27 pips above.
Price dropped to the next blue support zone at 154.80, netting 68 pips before a partial exit.
The trend continued downward while the signal remained valid.
Strategy Tips
- Prefer trading during active sessions when major pairs show clear swings.
- Wait for the German Sniper signal to confirm entry in the correct Fibonacci zone to reduce false signals.
- Consider scaling out positions as price approaches the next zone to secure profit.
- Monitor candle behavior near zone boundaries to avoid entries against strong momentum reversals.
Download Now
Download the “autofibo-trading-zones.mq4” Metatrader 4 indicator
FAQ
Can the trading zone colors be customized?
Yes, both the blue support zone and red resistance zone can be changed directly from the indicator’s input settings.
Should other tools be used for confirmation?
Yes, combining the zones with trend indicators or price action signals increases trade accuracy and reduces false entries.
How do I exit trades?
Trades can be closed when an opposite zone is reached, the trend changes, or by using your own exit strategy.
Summary
The Auto Fibonacci Trading Zones indicator for MT4 simplifies trend-aligned trading by highlighting dynamic support and resistance zones.
Blue and red zones indicate potential buy and sell areas, making entries easier to spot and more disciplined.
This indicator fits traders who rely on trend-following strategies and Fibonacci-based setups.
It works across multiple timeframes and currency pairs, providing clear visual zones for trading decisions.


