The Band Moving Average forex technical indicator for MT4 draws a set of tradable bands which are based on a moving average.
The Metatrader 4 indicator consists of a middle band and two outer bands.
The upper blue outer band is considered resistance while the lower green band is support.
Trading bands are a great way to put you in a favorable trading position.
- Look for buy trade opportunities when the slope of the bands are pointing to the upside
- Look for sell trade opportunities when the slope of the bands are pointing to the downside
Best zone to execute a buy trade: between the red and green band.
Best zone to execute a sell trade: between the blue and red band.
This works for any trading style.
Free Download
Download the “band-moving-average.mq4” MT4 indicator
Example Chart
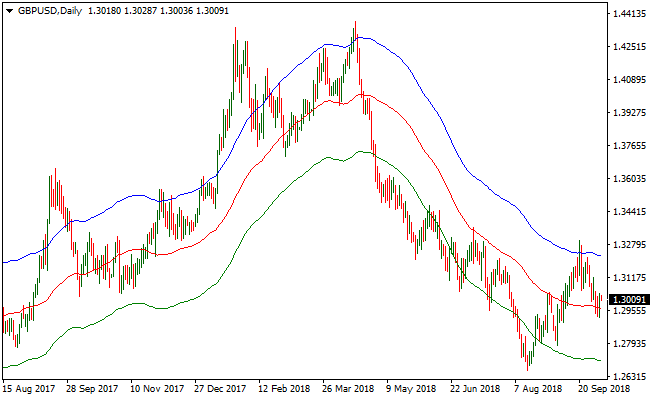
The GBP/USD Daily chart below displays the Band Moving Average Metatrader 4 Forex indicator in action.

Basic Trading Signals
Signals from the Band Moving Average MT4 forex indicator are easy to interpret and goes as follows:
Buy Signal: Open buy trade when price touches the red or green band and the bands are sloping up. Confirm the buy trade with other technical indicators or with price action techniques.
Sell Signal: Open sell trade when price touches the red or blue band and the bands are sloping down. Confirm the sell trade with other technical indicators or with price action techniques.
Trade Exit: Use your own method of trade exit.
Download
Download the “band-moving-average.mq4” Metatrader 4 indicator
MT4 Indicator Characteristics
Currency pairs: Any
Platform: Metatrader 4
Type: Chart pattern indicator
Customization options: Variable (Ma period, MA method, Percentage) Colors, width & Style.
Time frames: 1-Minute, 5-Minutes, 15-Minutes, 30-Minutes, 1-Hour, 4-Hours, 1-Day, 1-Week, 1-Month
Type: trend
Installation
Copy and paste the band-moving-average.mq4 into the MQL4 indicators folder of the Metatrader 4 trading platform.
You can access this folder from the top menu as follows:
File > Open Data Folder > MQL4 > Indicators (paste here)


