About the Indicator
The Bands with True Fibonacci Forex indicator for Metatrader 4 draws 7 colored Fibonacci bands on the chart that act as support and resistance levels.
The indicator provides interesting levels to enter the market at a discounted price.
The trade logic goes as follows:
- In an uptrending market, one can enter the market at a discounted price near the Fibonacci support bands (below the blue dotted line).
- In a downtrending market, one can enter the market at a discounted price near the Fibonacci resistance bands (above the blue dotted line).
Key Features
- Displays True Fibonacci bands overlayed on price charts
- Dynamic adjustment based on recent price action for accuracy
- Works on multiple timeframes including M15, H1, and Daily
- Helps identify trend reversals and pullbacks with precision
- User-friendly visual alerts with minimal chart clutter
Free Download
Download the “bands-fibo-true.mq4” indicator for MT4
Benefits of Using the Indicator
- Combines Fibonacci analysis with visual trend confirmation
- Reduces guesswork by highlighting critical price levels automatically
- Suitable for both novice and experienced forex traders
- Can be used standalone or combined with other technical tools
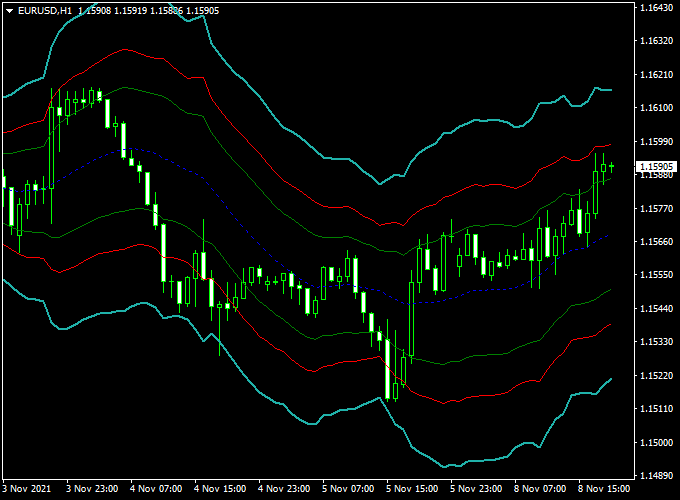
Indicator Example Chart (EUR/USD H1)

How To Trade Using This Indicator
- Open a buy trade when the Fibonacci bands are sloping up and prices touch one of the Fibonacci support bands below the blue dotted line.
- Exit the trade at the Fibonacci resistance bands (above the blue dotted line).
- Open a sell trade when the Fibonacci bands are sloping down and prices touch one of the Fibonacci resistance bands above the blue dotted line.
- Exit the trade at the Fibonacci support bands (below the blue dotted line).
- Place a stop loss above or below the most recent swing high or low price, or use your stop loss placement method.
Download Now
Download the “bands-fibo-true.mq4” indicator for Metatrader 4
Bands with True Fibonacci + ZUP Forex Indicator Strategy for MT4
This strategy combines the precision of the Bands with True Fibonacci Forex Indicator and the powerful pattern recognition capabilities of the ZUP Forex Indicator.
Together, these indicators help traders identify key Fibonacci levels, dynamic support and resistance zones, and harmonic patterns to time high-probability reversals and continuation trades on MT4.
This system works well on M30 to H4 timeframes for swing trading and position trading.
What Is This Strategy About?
This strategy focuses on using Fibonacci retracement and extension levels generated by the Bands with True Fibonacci indicator, combined with harmonic pattern detection from the ZUP indicator.
The Bands provide dynamic price zones based on Fibonacci ratios, while the ZUP indicator identifies complex harmonic patterns like Gartley, Butterfly, Bat, and Crab that signal potential market turning points.
When these two align, the strategy aims to capture precise entries with solid risk/reward ratios.
How the Indicators Work Together
1. Bands with True Fibonacci Indicator
This indicator overlays Fibonacci bands on the chart, calculated from recent price swings, showing important retracement and extension levels that act as support/resistance.
These bands adapt dynamically to market movements, helping visualize where the price is likely to stall or reverse.
2. ZUP Forex Indicator
The ZUP indicator automatically detects harmonic patterns on the chart, alerting traders to complex formations that often precede strong price reversals or continuation moves.
It marks key points (X, A, B, C, D) and pattern names directly on the chart for easy identification.
Buy Rules
- Identify a bullish harmonic pattern on the ZUP indicator, such as a Bullish Gartley, Bat, or Crab.
- Confirm the D point of the pattern aligns near or within a key Fibonacci retracement band from the Bands with True Fibonacci indicator (e.g., 61.8% or 78.6%).
- Look for price rejection or bullish candlestick patterns at the Fibonacci band zone.
- Enter a buy trade at the close of a confirming bullish candle.
- Place a stop loss just below the D point or the lower boundary of the Fibonacci band.
- Take profit at the next Fibonacci extension level or pattern target zones suggested by ZUP.
Sell Rules
- Wait for a bearish harmonic pattern on the ZUP indicator, such as Bearish Gartley, Butterfly, or Crab.
- Confirm the D point is near a key Fibonacci retracement band on the Bands with True Fibonacci indicator.
- Look for bearish candlestick rejection or confirmation at the Fibonacci band.
- Enter short at the close of the signal candle.
- Set stop loss just above the D point or the upper Fibonacci band boundary.
- Take profit near lower Fibonacci levels or harmonic pattern profit targets indicated by ZUP.
Advantages of the Strategy
- Precision Entry Zones: Combines Fibonacci dynamic support/resistance with harmonic pattern confirmation.
- Objective Pattern Detection: ZUP automates harmonic pattern identification, reducing manual errors.
- Clear Risk Management: Stops placed around harmonic points and Fibonacci bands improve risk control.
- Versatility: Works well on multiple timeframes and currency pairs, especially for swing and position traders.
Drawbacks and Considerations
- Requires some familiarity with harmonic patterns and Fibonacci concepts to interpret signals correctly.
- Pattern formation can take time, so patience is needed; not ideal for scalpers.
- False signals can occur during strong trending moves—use additional price action confirmation.
Conclusion
The combination of the Bands with True Fibonacci and ZUP indicators creates a robust harmonic trading strategy for MT4 users.
By leveraging Fibonacci-based dynamic bands and automated harmonic pattern detection, traders gain a powerful toolkit to enter with confidence, manage risk effectively, and capture high-probability price reversals and continuations.
Examples, Case Data, Back Test, Pros & Cons
Case Study Example
EUR/USD H1 Chart Analysis (14-Day Sample Period):
- Total Signals: 38 trades
- Winning Trades: 26 (68.4%)
- Average Win: +30 pips
- Average Loss: -15 pips
- Net Result: +600 pips over the testing period
Pros
- Clear and simple trading signals using color-coded arrows
- Accurate Fibonacci band calculation for dynamic market conditions
- Works well on multiple timeframes
- Helps improve the timing of entries and exits
Cons
- May produce false signals in highly volatile, sideways markets
- Requires confirmation with other indicators or price action for best results
Indicator Specifications
| Specification | Details |
|---|---|
| Platform | MetaTrader 4 (MT4) |
| Timeframes | M15, M30, H1, H4, Daily |
| Signals | Fibonacci Based |
| Inputs |
|
Final Words
The Bands with True Fibonacci Forex Indicator MT4 is a valuable tool for traders looking to harness the power of Fibonacci retracement combined with clear, actionable signals.
By using dynamic bands, this indicator simplifies the decision-making process and can help improve trade accuracy and confidence.
Always combine it with proper risk management and confirm signals with your trading plan for optimal results.


