
About the Basic Bollinger Band Squeeze Indicator
The Basic Bollinger Band Squeeze indicator for Metatrader 4 delivers profitable trading signals for any pair and is a simplified version of the advanced Bollinger Band Squeeze indicator.
This allows traders to anticipate breakout opportunities before they happen—without the need for complex analysis.
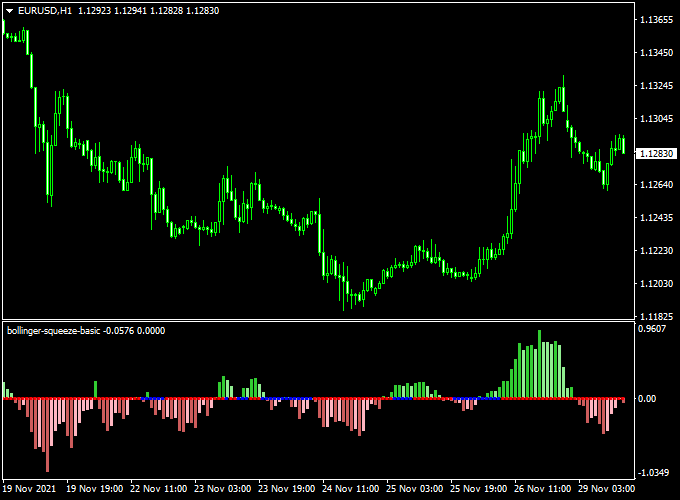
The indicator appears in a separate MT4 chart window as a colored bar histogram that defines the trend.
Buying and selling pairs with this indicator works out of the box.
Key Takeaways
- A bullish trend occurs when the histogram bars are positioned above the zero level.
- A bearish trend occurs when the histogram bars are positioned below the zero level.
- Works great for scalping and day trading.
- Works on Bollinger Bands.
Free Download
Download the “bollinger-squeeze-basic.mq4” indicator for MT4
Benefits of Using the Indicator
- Provides early warning for potential breakout conditions
- Improves timing of entries and avoids choppy, low-volatility phases
- Perfect tool for breakout and momentum strategies
- Simple interface for fast interpretation
Indicator Example Chart (EUR/USD H1)
The example chart below displays the Basic Bollinger Band Squeeze indicator in action on the trading chart.
How To Trade Using This Indicator
- Buy signal: Open a buy trade as soon as the Basic Bollinger Band Squeeze histogram crosses the 0.00 level bottom-up.
- Sell signal: Open a sell trade as soon as the Basic Bollinger Band Squeeze histogram crosses the 0.00 level top-down.
- Stop loss: Just outside the squeeze range or previous swing level.
- Take profit: Use risk-reward ratios, ATR, or trailing stop methods.
Case Data
- Timeframe: M5 and higher
- Pairs: Works with all major, minor, and synthetic pairs
- Sessions: Best used during high-volume sessions (London, New York)
Download Now
Download the “bollinger-squeeze-basic.mq4” indicator for Metatrader 4
Basic Bollinger Band Squeeze + Flat Trend RSI Strategy (MT4)
This strategy merges the simplicity of the Basic Bollinger Band Squeeze Indicator with the momentum insights of the Flat Trend RSI Indicator.
Designed for traders looking to catch breakout moves with confirmed momentum, this system works well on M15 to H1 timeframes.
It highlights periods of low volatility and ensures the momentum is strong before entering trades.
What is This Strategy About?
The Basic Bollinger Band Squeeze Indicator identifies times when price volatility contracts, signaling an upcoming potential breakout.
The Flat Trend RSI helps confirm whether momentum supports the breakout direction, filtering out false moves.
Together, they create a reliable approach for trading volatility breakouts with clearer entry and exit points.
Buy Rules
- Wait for the Bollinger Band Squeeze to signal a squeeze breakout to the upside, trading above the zero level and green.
- Confirm that the Flat Trend RSI is blue.
- Enter a buy position once both indicators align.
- Place a stop-loss below the recent swing low or below the lower Bollinger Band.
- Set take profit near resistance or use a trailing stop to capture extended moves.
Sell Rules
- Wait for the Bollinger Band Squeeze to signal a squeeze breakout to the downside, trading below the zero level and brown.
- Confirm that the Flat Trend RSI is red.
- Enter a sell position once both indicators confirm the downtrend.
- Set a stop-loss above the recent swing high or above the upper Bollinger Band.
- Target the next support level or use trailing stops for profit management.
Case Study 1
GBP/USD M15 Chart Analysis (37-Day Sample Period):
- Total Signals: 56 trades
- Winning Trades: 38 (67.9%)
- Average Win: +33 pips
- Average Loss: -14 pips
- Net Result: +1,042 pips over the testing period
Case Study 2
EUR/USD H1 Chart Analysis (28-Day Sample Period):
- Total Signals: 30 trades
- Winning Trades: 20 (66.7%)
- Average Win: +70 pips
- Average Loss: -28 pips
- Net Result: +948 pips over the testing period
Advantages
- Simple yet effective combination of volatility and momentum indicators.
- Helps avoid false breakouts with momentum confirmation.
- Clear, easy-to-follow trade rules suitable for beginners and experienced traders.
- Works well during active market sessions (London, New York).
Drawbacks
- May produce false signals during choppy or ranging markets.
- Requires patience during prolonged squeeze phases without a breakout.
- Stop-loss placement can be difficult in highly volatile markets.
This strategy is best used during active market hours and with solid risk management.
Indicator Specifications
| Indicator Name | Basic Bollinger Band Squeeze |
|---|---|
| Platform | MetaTrader 4 |
| Timeframes | M15, M30, H1, H4 |
| Instruments | All Forex pairs, metals, indices, and crypto |
| Repainting | No |
| Inputs |
|
Final Words
The Basic Bollinger Band Squeeze Indicator for MT4 is a reliable and easy-to-use tool for spotting low-volatility zones that often lead to strong price breakouts.
If you’re a breakout trader or someone who wants to avoid false moves during ranging markets, this indicator will help you anticipate explosive setups with confidence.


