
About the Bollinger Bands Histogram Indicator
The Bollinger Bands Histogram Indicator for MetaTrader 4 is a volatility-based trading tool built on the well-known Bollinger Bands concept.
Instead of plotting bands around price, it converts Bollinger Band behavior into a dual-colored histogram that reflects directional bias and momentum.
The indicator appears below the main trading chart and uses color changes to represent trend conditions.
Blue histogram bars signal bullish pressure, while red bars indicate bearish pressure.
This approach simplifies interpretation and allows traders to focus on direction rather than band expansion or contraction.
While the default Bollinger Band period is set to 20, many traders prefer increasing it to 50.
A higher period smooths the histogram and helps reduce whipsaw signals during choppy market phases.
The indicator can be traded on its own or combined with price action for additional confirmation.
Free Download
Download the “iBands_Advanced_Histo_v1.0.ex4” MT4 indicator
Key Features
- Bollinger Bands-based histogram trend indicator.
- Helps filter volatility-driven false signals.
- Adjustable Bollinger Band period settings.
- Works on all MT4 timeframes and currency pairs.
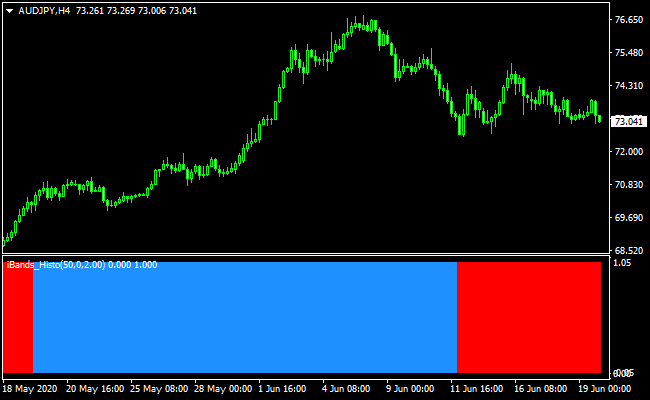
Indicator Chart
The chart below shows the Bollinger Bands Histogram Indicator applied to a forex pair.
The histogram switches color as volatility and direction change.
These transitions help traders identify potential trend continuation or early reversals without cluttering the price chart.
Guide to Trade with Bollinger Bands Histogram Indicator
Buy Rules
- The histogram changes color from red to blue.
- Market volatility supports upward movement.
- Enter the trade near the close of the signal candle.
Sell Rules
- The histogram changes color from blue to red.
- Market volatility supports downward movement.
- Enter the trade near the close of the signal candle.
Stop Loss
- For a buy signal, place the stop below the most recent support level.
- For a sell signal, set the stop loss above the most recent resistance level.
- ATR-based stops can be used during high volatility.
Take Profit
- Use a fixed pip target of your preference
- Use a fixed reward-to-risk ratio of 2:1 or higher.
- Trail profits while the histogram maintains the same color.
Bollinger Bands Histogram + Best Scalping Indicator MT4 Strategy
This MT4 scalping strategy combines the trend direction from the Bollinger Bands Buy/Sell Histogram Signals and the precise entry arrows from the Best Forex Scalping Indicator.
The histogram shows the underlying trend strength using color shifts. A blue histogram signals a bullish trend, while a red histogram signals a bearish one.
The scalping indicator then gives exact entry triggers through arrows. A blue arrow gives a buy signal, and a red arrow signals a sell.
By combining a trend filter with a direct entry tool, this strategy focuses only on trades where trend, momentum, and entry timing line up together.
This helps avoid low-quality trades that often appear on lower timeframes.
The method works well on M1 and M5 charts and is ideal for traders who enjoy fast-paced scalping with clear rules.
Buy Entry Rules
- The Bollinger Bands histogram must be blue to confirm a bullish trend.
- A blue arrow from the scalping indicator must appear.
- Enter a buy trade when both signals match.
- Place a stop loss under the recent swing low.
- Take profit between 6–12 pips on M1 or 12–20 pips on M5.
Sell Entry Rules
- The Bollinger Bands histogram must be red, showing a bearish trend.
- A red arrow from the scalping indicator must appear.
- Enter the sell trade when both signals align.
- Stop loss above the recent swing high.
- Take profit between 6–12 pips on M1 or 12–20 pips on M5.
Advantages
- Uses a trend filter plus an entry trigger for improved accuracy.
- Clear visual structure, easy to follow.
- Compatible with very fast timeframes.
- Well-suited for active market sessions with good volatility.
- Works on most major currency pairs.
Drawbacks
- Signals can flip quickly in choppy markets.
- Arrows may appear slightly late after volatility spikes.
- Spreads can affect performance with small profit targets.
Example Case Study 1: EUR/USD on M1
During the London open, EUR/USD began forming a small bullish push. The Bollinger Bands histogram switched to blue, showing a new upward trend.
A few candles later, the scalping indicator printed a blue arrow.
The trade was opened with a stop loss below the recent small pullback.
Price continued upward quickly and hit the 10-pip take profit in under ten minutes.
The strong alignment between trend and arrow made this scalp clean and straightforward.
Example Case Study 2: GBP/JPY on M5
Later in the New York session, GBP/JPY reversed from a high and started trending downward.
The Bollinger histogram turned red, confirming increasing selling pressure.
Shortly after, the scalping indicator produced a red arrow.
A sell trade was taken and protected with a stop above the previous swing.
Over the next few candles, GBP/JPY dropped steadily and hit the 18-pip target without retracing.
Strategy Tips
- Use very liquid pairs such as EUR/USD, GBP/JPY, USD/JPY, or XAU/USD for better volatility.
- Do not take trades when the histogram flips color every few bars.
- Best results occur during London or early New York trading hours.
- Test different stop and target distances per pair to find what works best.
- Keep charts clean; avoid extra indicators that may delay decisions.
- Stay patient and only trade when the histogram color and arrow match.
Download Now
Download the “iBands_Advanced_Histo_v1.0.ex4” Metatrader 4 indicator
FAQ
Why convert Bollinger Bands into a histogram?
The histogram format removes visual clutter and focuses attention on directional bias rather than bandwidth or price touches.
Is a higher Bollinger Band period always better?
Higher periods reduce noise but also slow the signal frequency.
Traders should balance smoothness with responsiveness based on timeframe.
Can this indicator confirm breakout trades?
Yes, strong color continuation during volatility expansion can support breakout confirmation.
Summary
The Bollinger Bands Histogram Indicator for MT4 offers a streamlined way to trade volatility-driven trends using simple color changes.
By transforming Bollinger Band data into a histogram, it reduces complexity and improves decision speed.
With flexible settings and compatibility across scalping, day trading, and swing trading styles, the indicator adapts well to different market conditions.
When paired with disciplined risk management and the broader market trend, it provides a practical approach to trading Bollinger-based momentum.


