
About the Bollinger Bands Histogram Indicator
The Bollinger Bands Histogram indicator for MT4 is a momentum-focused variation of the classic Bollinger Bands tool.
Instead of plotting bands directly on the price chart, it converts Bollinger Band behavior into a histogram displayed in a separate indicator window.
The histogram oscillates between fixed upper and lower extremes, typically around 1.1 and -1.1.
Bars plotted above the zero line represent bullish momentum, while bars below the zero line reflect bearish momentum.
The distance from the zero level gives an idea of strength rather than direction alone.
By filtering signals with a trend-following indicator, traders can focus only on momentum that supports the prevailing direction.
This makes the Bollinger Bands Histogram a practical tool for trend continuation and momentum-based entries.
Free Download
Download the “bb-histogram-indicator.mq4” MT4 indicator
Key Features
- Displays Bollinger Band momentum as a histogram in a separate window.
- Uses the zero level to separate bullish and bearish market pressure.
- Fixed upper and lower bounds help gauge momentum intensity.
- Works smoothly with moving averages and trend indicators.
- Customizable Bollinger period to match different trading styles.
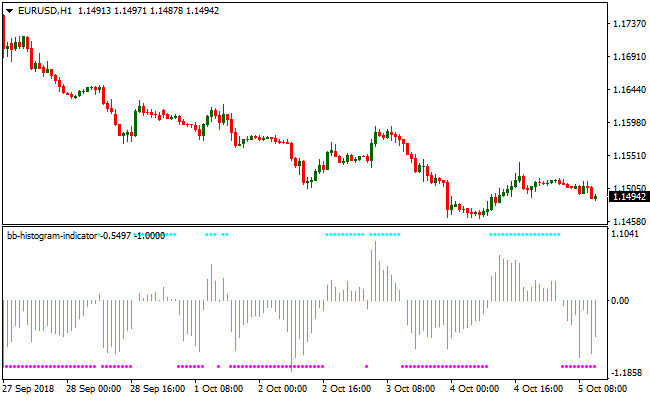
Indicator Chart
The Bollinger Bands Histogram indicator chart shows colored bars fluctuating around the zero line.
Bars above zero highlight bullish momentum, while bars below zero reflect bearish momentum.
When combined with a trend filter on the main chart, the histogram helps pinpoint aligned entry opportunities.
Guide to Trade with Bollinger Bands Histogram Indicator
Buy Rules
- Confirm the overall market trend is bullish using a trend-following indicator.
- Wait for the histogram bars to move and remain above the zero line.
- Enter a buy trade once bullish bars form in line with the trend.
- Ignore buy signals if the higher-timeframe trend turns bearish.
Sell Rules
- Confirm the overall market trend is bearish using a trend-following indicator.
- Wait for the histogram bars to move and remain below the zero line.
- Enter a sell trade once bearish bars form in line with the trend.
- Ignore sell signals if the higher-timeframe trend turns bullish.
Stop Loss
- For buy trades, set the stop loss below a nearby support reaction on the price chart.
- For sell trades, place the stop loss above a nearby resistance reaction.
- Adjust the stop distance to reflect current volatility conditions.
Take Profit
- Close buy trades when the histogram crosses back below the zero line.
- Close sell trades when the histogram crosses back above the zero line.
- Alternatively, target a predefined support or resistance level.
Bollinger Bands Histogram + Cougar Indicator MT4 Scalping Strategy
This MT4 scalping strategy combines the momentum view of the Bollinger Bands Histogram indicator with the trend confirmation of the Cougar Forex Indicator.
It is designed for traders who prefer fast entries and small, consistent profits.
The method works well on M5, M15 and M30 charts, especially during active market sessions where volatility is higher.
The histogram identifies when the market gains directional pressure, while the Cougar arrows confirm whether the trend supports the move.
Buy Entry Rules
- The Bollinger Bands Histogram prints green bars above the zero line.
- The Cougar indicator plots a blue arrow signaling bullish trend direction.
- Enter a buy position only after the signal candle closes.
- Place a stop loss below the most recent minor swing low or use a fixed size relevant to the pair.
- Take profit at 10 to 20 pips for scalping or exit when the histogram weakens or Cougar shifts direction.
Sell Entry Rules
- The Bollinger Bands Histogram prints green bars below the zero line, showing bearish momentum.
- The Cougar indicator plots a red arrow confirming a downward trend.
- Enter a sell position when the candle closes.
- Set stop loss a few pips above the recent swing high or use a fixed pip distance.
- Take profit at 10 to 20 pips or exit when the histogram begins to fade or Cougar reverses.
Advantages
- Easy to read signals suitable for fast intraday trading.
- Double confirmation reduces incorrect entries.
- Useful on many FX pairs because it adapts well to short term volatility.
- Clear logic makes it simple to execute without overthinking.
Drawbacks
- False signals are more common in slow or ranging markets.
- Spreads and commissions can reduce profit if trading too frequently.
Example Case Study 1 (EURUSD M15)
During the early London session, EURUSD showed rising momentum as the Bollinger Bands Histogram formed green bars above the zero line.
Shortly after, the Cougar indicator printed a blue arrow.
A buy trade was taken after the candle close.
Stop loss was placed slightly under the nearest swing low.
The pair moved upward steadily and hit a 16 pip target.
Momentum slowed shortly after, showing that early entries with confirmation provide quick scalping opportunities.
Example Case Study 2 (AUDUSD M5)
Later in the New York session, AUDUSD experienced a short burst of volatility.
The Bollinger Bands Histogram printed green bars below zero, signaling fresh bearish pressure.
The Cougar indicator aligned with a red arrow confirming trend direction.
A sell position was entered at candle close.
Price moved quickly, producing a 14 pip profit before losing momentum.
Strategy Tips
- Trade pairs with low spreads and enough movement such as EURUSD, GBPUSD, USDJPY or AUDUSD.
- Focus on active market sessions where signals are cleaner.
- Use a fixed number of trades per day to avoid overtrading.
- Strengthen entries by waiting for two consecutive histogram bars in the same direction.
- Backtest each pair to find optimal stop loss and take profit distances.
- Reduce trade size during low liquidity periods.
Download Now
Download the “bb-histogram-indicator.mq4” Metatrader 4 indicator
FAQ
Which trend indicators work best with this histogram?
Common choices include the 75 period exponential moving average, Parabolic SAR, and the 200 period simple moving average.
These tools help define the dominant trend clearly.
Can the Bollinger period be adjusted?
Yes, the default period is set to 14, but traders can change it to suit faster or slower market conditions.
Shorter periods increase responsiveness, while longer periods smooth the output.
Is this indicator suitable for ranging markets?
The indicator performs best in trending conditions.
In sideways markets, histogram signals may alternate frequently and reduce effectiveness.
Summary
The Bollinger Bands Histogram indicator for MT4 transforms a classic volatility concept into a momentum-based histogram that is easy to interpret.
By separating bullish and bearish pressure around a zero line, it helps traders stay focused on trend-aligned opportunities.
This indicator fits traders who prefer confirmation-driven strategies and already rely on trend filters.
Its flexibility through adjustable settings allows it to adapt to different instruments and timeframes.


