
About the Bollinger Bands Stop v2 Indicator
The Bollinger Bands Stop V2 indicator for MT4 is a powerful buy and sell signals indicator with stop loss levels based on the Bollinger Bands.
The indicator appears in the main MT4 chart window as colored blue and red signal lines.
Unlike standard Bollinger Bands, this version plots stop-level bands either above or below the price, depending on the market trend.
Key Takeaways
- A bullish market occurs whenever the blue signal line appears on the chart.
- A bearish market occurs whenever the red signal line appears on the chart.
- Bollinger Bands Stop V2 indicator is always active in the market.
- Based on the Bollinger Bands technical indicator.
Free Download
Download the “Bollinger Bands_Stop_v2 .ex4” indicator for MT4
Main Features
- Dynamic stop lines based on Bollinger Band logic
- Blue stop line appears in bullish trends
- Red stop line appears in bearish trends
- Perfect for trend entries and trailing stops
- Works on all timeframes and pairs
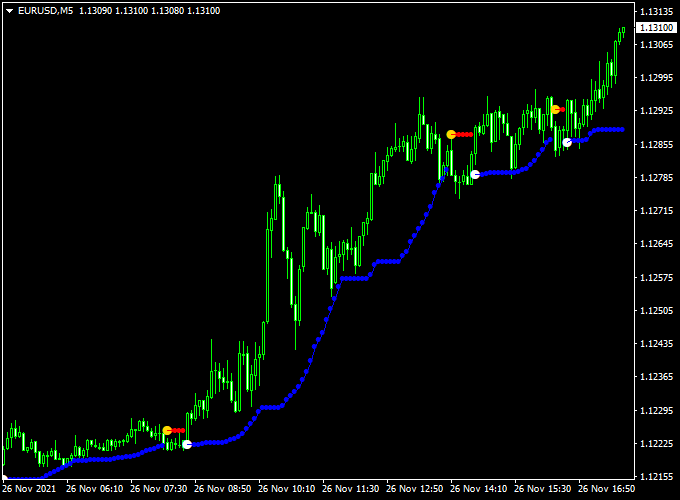
Indicator Example Chart (EUR/USD M5)
The example chart below displays the Bollinger Bands Stop V2 indicator in action on the trading chart.
How to Trade Using This Indicator
Entry and Exit Rules:
- Buy signal: Initiate a buy trade as soon as the blue Bollinger Bands Stop V2 indicator signal line gets painted on the chart.
- Sell signal: Initiate a sell trade as soon as the red Bollinger Bands Stop V2 indicator signal line gets painted on the chart.
- Stop Loss: Use the opposite stop line (above or below the price) as your dynamic SL level.
- Take Profit: Use a 1:2 or 1:3 risk-reward ratio or exit when the trend color flips.
Pros
- Excellent for identifying and following strong trends
- Built-in logic for dynamic stop-loss placement
- Easy visual cue for beginners and advanced traders alike
- Reduces overtrading in choppy markets
Cons
- Less effective during sideways or low-volatility markets
- Lagging indicator due to trend smoothing
Download Now
Download the “Bollinger Bands_Stop_v2 .ex4” indicator for Metatrader 4
Bollinger Bands Stop v2 + Forex Trend Filter Strategy (MT4)
This trading strategy combines the dynamic stop-and-trend detection of the Bollinger Bands Stop v2 Indicator with the trend confirmation power of the Forex Trend Filter Indicator.
Together, they create a rule-based system that excels at identifying low-risk entries during strong market trends.
This strategy is ideal for intraday and swing traders who want to trade with the trend while minimizing noise and whipsaws.
What is This Strategy About?
The Bollinger Bands Stop v2 indicator shows dynamic trailing stops and trend shifts by plotting color-changing dots above or below the price.
When the dots flip from above to below the candles, it suggests a potential bullish trend, and vice versa for bearish conditions.
The Forex Trend Filter complements this by visually confirming the overall trend direction with a colored histogram.
When both indicators are aligned, traders can confidently enter trend-based trades with clear entry and exit zones.
Buy Rules
- Wait for the Bollinger Bands Stop v2 dots to appear below the price, indicating a potential uptrend.
- Confirm that the Forex Trend Filter is blue or signaling an upward trend.
- Enter a buy trade when both conditions are met.
- Place a stop-loss below the most recent swing low or the last dot of the Bollinger Bands Stop v2.
- Set the take profit at a predefined resistance level or use a risk-reward ratio of at least 1:2.
Sell Rules
- Wait for the Bollinger Bands Stop v2 dots to appear above the price, indicating a potential downtrend.
- Confirm that the Forex Trend Filter is red or signaling a downward trend.
- Enter a sell trade when both conditions align.
- Place a stop-loss above the recent swing high or last dot of the Bollinger Bands Stop v2.
- Take profit at the next support zone or use a fixed risk-reward plan.
Case Study 1
GBP/JPY M30 Chart Analysis (36-Day Sample Period):
- Total Signals: 44 trades
- Winning Trades: 30 (68.2%)
- Average Win: +42 pips
- Average Loss: -18 pips
- Net Result: +1008 pips over the testing period
Case Study 2
EUR/USD H4 Chart Analysis (40-Day Sample Period):
- Total Signals: 20 trades
- Winning Trades: 13 (65%)
- Average Win: +97 pips
- Average Loss: -41 pips
- Net Result: +974 pips over the testing period
Advantages
- Highly accurate trend detection with visual confirmation from both indicators.
- Trailing stop functionality helps lock in profits and manage risk effectively.
- Reduces confusion by only taking trades when both tools are aligned.
- Suitable for M15 to H4 timeframes in both trending and volatile conditions.
Drawbacks
- Performance drops during sideways markets or when trends frequently reverse.
- Requires patience to wait for both indicators to align, which may reduce the number of trades.
- Best used during major market sessions to avoid false signals.
This combination strategy works best in clean trending environments, especially when trading highly liquid forex pairs like GBP/JPY, EUR/USD, and USD/JPY.
Indicator Specifications
| Indicator Name | Bollinger Bands Stop v2 |
|---|---|
| Platform | MetaTrader 4 |
| Type | Trend-following, Stop-loss guidance |
| Timeframes | All (M15, H1, H4 recommended) |
| Pairs | All Forex pairs, indices, gold, and crypto |
| Inputs | Bollinger period, deviation, band shift |
| Repaint | No |
Final Words
The Bollinger Bands Stop v2 indicator is ideal for traders who want a no-nonsense trend tool that offers both direction and intelligent stop placement.
It keeps you in trades longer and helps avoid premature exits.
Use it as part of your trend-trading strategy or pair it with momentum indicators for extra confirmation.


