
About the Bollinger Bands W Signal Indicator
The Bollinger Bands W Signal indicator for Metatrader 4 provides buy and sell signals based on the Bollinger Bands.
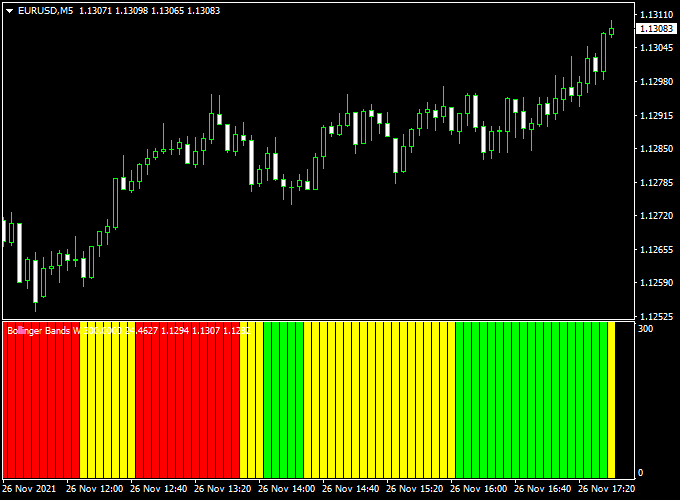
The indicator appears in a separate MT4 chart window as colored trend histogram bars.
Buying and selling currency pairs with this indicator is utterly simple, even for beginners.
Key Takeaways
- The trend bias is considered bullish whenever the green histogram bars appear on the chart.
- The trend bias is considered bearish whenever the red histogram bars appear on the chart.
- Yellow colored indicator bars indicate a range-bound market.
- Based on the Bollinger Bands technical indicator.
The Bollinger Bands W Signal indicator can also be used to confirm trading signals issued by other trading systems or strategies, or as an additional trend filter.
Free Download
Download the “Bollinger Bands W.mq4” indicator for MT4
Indicator Example Chart (EUR/USD M5)
The example chart below displays the Bollinger Bands W Signal indicator in action on the trading chart.
How to Trade with It
- Buy signal: Initiate a buy trade as soon as the first green Bollinger Bands W Signal histogram bar appears on the chart.
- Sell signal: Initiate a sell trade as soon as the first red Bollinger Bands W Signal histogram bar appears on the chart.
- Keep the trade open when the yellow bar gets printed on the chart.
As always, please trade in agreement with the overall trend and practice on a demo account first.
Utilize your own favorite stop loss and take profit method.
Best Timeframes & Use Cases
- M15, M30, H1 for intraday setups
- H4 and Daily for swing trading signals
- Especially effective in sideways or ranging markets
- Use with confirmation tools like RSI or MACD for added accuracy
Download Now
Download the “Bollinger Bands W.mq4” indicator for Metatrader 4
Bollinger Bands W Signal + Fibonacci Pivots Forex Strategy (MT4)
This strategy combines the power of the Bollinger Bands W Signal Indicator with the support/resistance strength of the Fibonacci Pivots Indicator.
The system is designed to capture short-term price reversals and trend continuations around key pivot zones using volatility bands and Fibonacci-based support/resistance levels.
This setup is particularly useful for intraday traders seeking reactive entries with high reward-to-risk potential.
What is This Strategy About?
The Bollinger Bands W Signal indicator provides timely buy and sell signals based on price behavior around Bollinger Bands.
When paired with the Fibonacci Pivots, which plot dynamic support and resistance levels for the day or week, traders gain an edge in filtering out false signals and confirming high-probability trade zones.
This strategy is suitable for M5 to H1 charts and is best used during active market sessions like London and New York.
Buy Rules
- Wait for a buy signal from the Bollinger Bands W Signal indicator near or slightly below a Fibonacci pivot support level (S1, S2, etc.).
- Enter a buy trade when both conditions align.
- Place a stop-loss 10–15 pips below the nearest pivot level or recent swing low.
- Take profit at the central pivot point (P) or the next resistance level (R1 or R2).
Sell Rules
- Wait for a sell signal from the Bollinger Bands W Signal indicator near or above a Fibonacci pivot resistance level (R1, R2, etc.).
- Enter a sell trade when both conditions are met.
- Place a stop-loss 10–15 pips above the nearest pivot level or recent swing high.
- Take profit at the central pivot (P) or the next support level (S1 or S2).
Case Study 1
EUR/GBP M5 Chart Analysis (10-Day Sample Period):
- Total Signals: 60 trades
- Winning Trades: 41 (68.3%)
- Average Win: +24 pips
- Average Loss: -13 pips
- Net Result: +737 pips over the testing period
Case Study 2
USD/CAD H1 Chart Analysis (20-Day Sample Period):
- Total Signals: 34 trades
- Winning Trades: 22 (64.7%)
- Average Win: +62 pips
- Average Loss: -28 pips
- Net Result: +1028 pips over the testing period
Advantages
- Combines volatility-based entries with logical Fibonacci pivot zones.
- Provides clearly defined entry and exit areas, making trade planning easier.
- Effective for both scalping and intraday swing trading.
- Reduces noise by using dual confirmation from two separate methodologies.
Drawbacks
- It can produce false signals during high-impact news or low-volume sessions.
- Requires quick decision-making on lower timeframes like M5.
- Performance depends on accurate pivot levels and clean trend structure.
To maximize results, this strategy should be used during volatile trading hours and in clearly trending or well-respected range-bound markets.
Avoid trading during major news releases or when the price is chopping around the central pivot.
Indicator Specifications
| Indicator Name | Bollinger Bands with Signal |
|---|---|
| Platform | MetaTrader 4 |
| Timeframes | All (Recommended: M15–H4) |
| Pairs | All Forex pairs, Gold, Indices, Crypto |
| Inputs | Period, Deviation, Bar colors, Alert options |
| Repaint | No |
Conclusion
If you’re looking for a Bollinger Bands-based system with actionable trade signals, this indicator saves time and improves clarity.
The added signal bars remove guesswork and help time your entries more effectively.
Whether you’re trading intraday reversals or swing breakouts, this tool can help spot high-probability setups based on volatility.


