About the Bollinger Bands Buy/Sell Sniper Indicator
The Bollinger Bands Buy/Sell Sniper indicator for MT4 is designed to help traders identify short-term trend changes using the slope of the Bollinger Bands.
Instead of focusing on price touching the bands, this indicator analyzes the bands’ direction to determine market bias.
This makes it especially useful for spotting early momentum shifts.
The indicator plots a colored signal line that changes based on whether the Bollinger Bands are sloping upward or downward.
A green signal line indicates bullish momentum, while a red signal line signals bearish conditions.
This visual approach allows traders to react quickly without overanalyzing multiple indicators.
It performs best when markets begin to move away from consolidation and into directional phases.
Free Download
Download the “BB_Analyzer_2.01.ex4” MT4 indicator
Key Features
- Signal line based on the positive or negative slope of Bollinger Bands.
- Clear visual indication of bullish and bearish momentum.
- Works on all currency pairs and timeframes.
- Helps identify early short-term trend changes.
- Simple logic suitable for discretionary and rule-based traders.
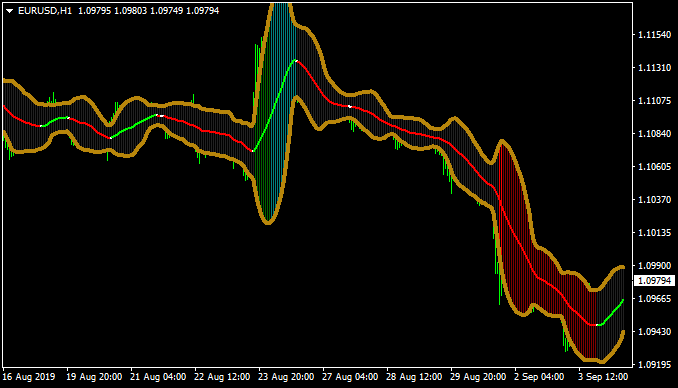
Indicator Chart
The Bollinger Bands Buy/Sell Sniper indicator displays a colored signal line on the main price chart.
The color reflects the current Bollinger Bands slope and trend direction.
The chart highlights moments when momentum shifts from bearish to bullish or vice versa, offering clear buy and sell opportunities aligned with short-term market direction.

Guide to Trade with Bollinger Bands Buy/Sell Sniper Indicator
Buy Rules
- Wait for the Bollinger Bands Buy/Sell Sniper signal line to change from red to green.
- Confirm the Bollinger Bands begin sloping upward.
- Enter a buy trade at the close of the confirming candle.
- Trade in line with the new short-term bullish trend.
Sell Rules
- Wait for the Bollinger Bands Buy/Sell Sniper signal line to change from green to red.
- Confirm the Bollinger Bands begin sloping downward.
- Enter a sell trade at the close of the confirming candle.
- Trade in line with the new short-term bearish trend.
Stop Loss
- Place the stop loss below short-term support for buy trades.
- Place the stop loss above short-term resistance for sell trades.
- Use recent swing highs or lows for precise risk control.
Take Profit
- Target recent price highs or lows, depending on trade direction.
- Trail the stop loss while the signal line remains the same color.
- Exit the trade when the signal line changes color.
Bollinger Buy/Sell Sniper Indicator + RSI Forex Scalping Strategy for MT4
This MT4 scalping strategy combines the Bollinger Buy/Sell Sniper indicator and the RSI Relative Strength Index indicator.
The Bollinger Buy/Sell Sniper shows a green line for a bullish trend and a red line for a bearish trend.
The RSI indicator acts as a confirmation: RSI above zero signals buying strength, while RSI below zero signals selling strength.
This strategy is optimized for M1 and M5 charts, ideal for scalpers looking to trade in the direction of short-term trends while confirming entries with momentum.
Buy Entry Rules
- The Bollinger Buy/Sell Sniper line turns green, indicating a bullish trend.
- The RSI is above zero, confirming upward momentum.
- Enter a buy trade when both conditions align.
- Set the stop loss depending on recent price action: for M1 trades, use 6–12 pips below the last swing low; for M5 trades, 15–20 pips is often appropriate.
- Set the take profit dynamically: on M1 aim for 12–18 pips, on M5 aim for 25–35 pips, or adjust based on volatility and recent candle range.
- A trailing stop can also be used to capture extended moves.
Sell Entry Rules
- The Bollinger Buy/Sell Sniper line turns red, indicating a bearish trend.
- The RSI is below zero, confirming downward momentum.
- Enter a sell trade when both indicators confirm the trend.
- Set the stop loss based on recent highs: for M1 trades, 6–12 pips above the recent swing high; for M5 trades, 15–20 pips.
- Set the take profit dynamically: on M1 aim for 10–18 pips, on M5 aim for 25–40 pips, or use a trailing stop to capture longer moves.
Advantages
- Combines trend detection with momentum confirmation for precise entries.
- Scalable for both M1 and M5 timeframes.
- Flexible take profit and stop loss levels allow adaptation to market conditions.
- Clear visual signals reduce guesswork and improve decision-making.
- Can be applied to multiple currency pairs with active intraday movement.
Drawbacks
- Scalping requires constant monitoring, which can be tiring for traders over long sessions.
- Frequent trades increase transaction costs, which can reduce net profitability.
- May generate false signals during low-volume periods, such as early Asian session hours.
- RSI may lag slightly on very fast M1 candles, causing delayed entries.
- Traders may be tempted to overtrade if signals are frequent, increasing risk exposure.
Case Study 1 — EUR/JPY on M1
On the EUR/JPY M1 chart, the Bollinger Buy/Sell Sniper line turned green, signaling a bullish trend.
The RSI was above zero, confirming upward momentum.
A buy trade was entered with a stop loss of 8 pips below the recent swing low and a take profit of 14 pips.
Price moved quickly in favor, reaching the target in a few minutes and capturing the scalp efficiently.
Case Study 2 — GBP/USD on M5
On the GBP/USD M5 chart, the Bollinger Buy/Sell Sniper line turned red, showing a bearish trend.
The RSI was below zero, confirming the downward momentum.
A sell trade was opened with a stop loss of 18 pips above the last swing high.
The take profit was set to 30 pips based on recent candle volatility.
Price continued to decline, and the trade closed near the target with a strong profit.
Strategy Tips
- Adjust stop loss and take profit according to recent volatility; don’t use fixed levels for all trades.
- Use higher timeframes to check the overall trend direction before scalping M1/M5 charts.
- Consider using a trailing stop once the trade is profitable to capture extended moves.
- Focus on currency pairs with tight spreads and high liquidity for better execution.
- Wait for both the Bollinger trend and the RSI confirmation to avoid false entries.
Download Now
Download the “BB_Analyzer_2.01.ex4” Metatrader 4 indicator
FAQ
How is this indicator different from standard Bollinger Bands?
Instead of focusing on price touching the bands, this indicator evaluates the slope of the Bollinger Bands to identify momentum shifts.
What market conditions suit this indicator best?
The indicator performs best during emerging trends and momentum phases rather than tight consolidation ranges.
Can this indicator be combined with other tools?
Yes. Traders often combine it with support and resistance or momentum indicators to refine entries and manage risk.
Summary
The Bollinger Bands Buy/Sell Sniper MT4 indicator offers a practical way to trade short-term momentum using Bollinger Band slope analysis.
Its color-coded signal line makes trend changes easy to spot and act upon.
The indicator is simple to use, adaptable across markets, and effective when paired with disciplined risk management.
With proper confirmation and market selection, it can become a valuable addition to any trend-based trading approach.


