
About the Breakout RSI Indicator
The Breakout RSI Indicator for MT4 is a specialized technical tool that enhances the capabilities of the traditional Relative Strength Index.
While the standard RSI is often used to identify overbought or oversold conditions, this version is engineered to detect specific price points where momentum is likely to surge.
It calculates these levels based on relative strength dynamics and displays them directly on your chart.
This allows traders to identify exactly where a currency pair is likely to transition from a period of consolidation into a sustained trend.
Free Download
Download the “breakout-rsi-indicator.mq4” MT4 indicator
Key Features
- Calculates and displays precise breakout long and breakout short price levels.
- Combines traditional RSI momentum logic with specific price action triggers.
- Provides real-time directional bias to help traders stay on the right side of the trend.
- Works effectively across all timeframes, from the M1 for scalping to the Daily for swing trading.
- Integrates easily with other technical analysis methods for a more robust trading plan.
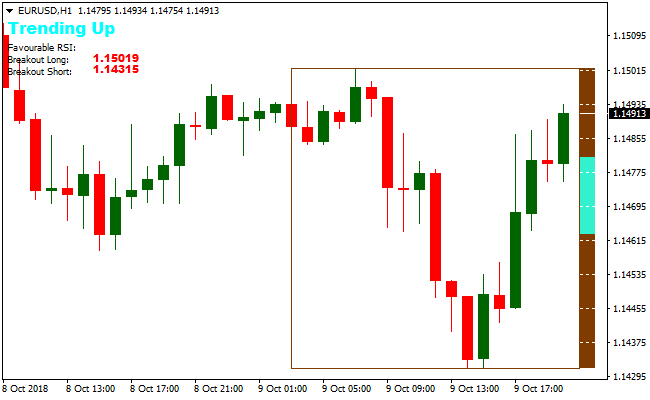
Indicator Chart
The Breakout RSI Indicator displays directly on the MT4 price chart with clear labels for entry points.
It highlights a “breakout long” price and a “breakout short” price, which serve as your primary triggers.
When price moves toward and touches these levels, it indicates that momentum is building in that specific direction.
Guide to Trade with Breakout RSI Indicator
Buy Rules
- Monitor the chart for the “breakout long” price level identified by the indicator.
- Initiate a buy trade the moment the price touches this specific long breakout target.
- Confirm the signal by ensuring that the overall trend on a higher timeframe is bullish.
- Verify that there is sufficient volume or volatility to support the upward move.
Sell Rules
- Look for the “breakout short” price level displayed by the Breakout RSI Indicator.
- Execute a sell trade immediately when the market price touches the short breakout level.
- Check for bearish price action confirmation, such as a break of a minor support zone.
- Ensure the broader market sentiment aligns with a downward move to increase the success rate.
Stop Loss
- Place the stop loss a few pips below the most recent swing low for buy positions.
- Position the stop loss above the nearest swing high for sell positions.
- Adjust the stop distance based on the timeframe used to account for market noise.
Take Profit
- Target the next major support or resistance level identified on the hourly or daily chart.
- Consider closing the trade if the price stalls and fails to maintain momentum after the break.
- Use a trailing stop to protect profits as the trend extends in the direction of the breakout.
Breakout RSI + Trend Predictor Forex Scalping Strategy for MT4
This MT4 strategy merges the breakout-based entries from the Breakout RSI Indicator with trend confirmation signals from the Trend Predictor v1.0 Indicator.
The idea is to use the breakout levels provided by Breakout RSI to trigger entries and rely on the Trend Predictor’s arrow signals to confirm momentum.
This combination works well on low to medium timeframes such as M5, M15 or even H1, and is suitable for traders who want a balance between breakout precision and trend-following strength.
By waiting for both a price action trigger (breakout level reached) and trend confirmation, the method reduces random trades and improves signal reliability.
Buy Entry Rules
- Wait until price touches the “breakout long” level defined by the Breakout RSI indicator.
- Check that the Trend Predictor shows a blue arrow indicating a bullish trend at or near that moment.
- Open a long trade on the price touch or on the next candle open if confirmation holds.
- Place the stop loss a few pips below a recent swing low or below the breakout level, whichever is tighter.
- Set take profit at the next resistance zone, or aim for a moderate gain depending on volatility (for instance, 20–40 pips).
- Optionally trail stop when price moves favorably.
Sell Entry Rules
- Wait until price touches the “breakout short” level from the Breakout RSI indicator.
- Confirm a red arrow from Trend Predictor appears around that moment signaling a bearish trend.
- Open a short trade at the price touch or next candle open if confirmation holds.
- Set stop loss a few pips above the recent swing high or above the breakout level, whichever is tighter.
- Take profit at the next support zone or aim for a defined target (e.g. 20–40 pips), or use a trailing stop if price moves in your favor.
Advantages
- Breakout RSI gives precise entry levels based on volatility and momentum breakdown.
- Trend Predictor provides simple, easy to spot trend arrows to confirm trade direction.
- Combining both reduces the chance of entering weak breakouts or fading dead trends.
- Flexible enough to work on multiple timeframes and various currency pairs.
- Can be used for both scalping (on M5/M15) or more relaxed intraday trades (on H1).
Drawbacks
- If the Trend Predictor arrow appears slightly late, the trade may miss optimal entry or enter after much of the move is done.
- In fast, volatile sessions price may trigger a breakout and then reverse quickly, hitting the stop loss before gaining momentum.
- Trailing stops or manual exits may be needed to avoid giving back profits in choppy markets, adding subjectivity.
Case Study 1
On USDCHF H1 during a moderately trending session, the pair approached the “breakout long” level defined by Breakout RSI.
As price touched that level, the Trend Predictor displayed a blue arrow.
A long position was entered at the next candle open. Stop loss was placed just below the recent swing low.
Over the next several candles the price gradually climbed, breaking through small resistance levels, and eventually reached a strong resistance zone about 35 pips above entry.
The trade was closed manually with a healthy profit.
Case Study 2
On NZDUSD M15 during a session with moderate volatility price dipped to the “breakout short” level from Breakout RSI.
The Trend Predictor gave a red arrow at almost the same time.
A short trade was opened immediately at the level touch. Stop loss was placed above the recent swing high.
Price dropped sharply over the next few candles, dipping toward the next support zone and delivering around 28 pips profit before slowing down.
Strategy Tips
- Always wait for the price to touch the breakout level and confirm with the Trend Predictor arrow. Do not trade on the breakout level only.
- Prefer trading during active periods when volatility is present, not during major news spikes or extreme market uncertainty.
- Use tight stops relative to breakout levels to limit risk, especially since breakouts can be false or reversed quickly.
- If using a higher timeframe (H1), allow slightly larger stop and profit targets because moves tend to be bigger but also slower.
- On the M5/M15 trading charts, use smaller targets and act quickly.
- Consider using a trailing stop once price moves in your favor to secure gains while allowing room for larger swings.
- Limit the number of trades per day to avoid overtrading. Only take setups with strong confirmation to maintain quality over quantity.
Download Now
Download the “breakout-rsi-indicator.mq4” Metatrader 4 indicator
FAQ
How does the Breakout RSI Indicator differ from a regular RSI?
A regular RSI is an oscillator that sits in a separate window and moves between 0 and 100.
The Breakout RSI Indicator takes that momentum data and translates it into specific price levels on your main chart.
This makes it much easier to know exactly when to enter a trade because you have a fixed price target rather than just a vague overbought or oversold reading.
Can I change the RSI period used for the calculations?
Most versions of this tool allow you to adjust the underlying RSI period in the settings.
A shorter period will make the breakout levels more sensitive and frequent, while a longer period will result in fewer but more significant breakout signals.
Summary
The Breakout RSI Indicator is a powerful utility for traders who want to combine momentum analysis with price-level precision.
By providing clear entry triggers, it removes the guesswork often associated with using oscillators.
Its primary benefit is the ability to highlight high-velocity areas in the market, allowing you to join a move just as it begins to accelerate.
To maximize your results, always use these breakout levels in conjunction with a solid understanding of market structure.
Trading breakouts in the direction of the dominant trend is the most effective way to use this tool.


