About the Bull Bear Signals Dashboard
The Bull Bear Signals Dashboard for MT4 is a market scanning tool that helps traders identify which currency pairs show bullish or bearish conditions at a glance.
Instead of switching between multiple charts, the indicator displays trend bias in a compact dashboard window.
The dashboard is built around Commodity Channel Index extreme levels.
By default, it uses CCI values of -100 and 100 to determine whether a market leans bullish or bearish.
When price momentum pushes CCI beyond these levels, the indicator updates its bull or bear status accordingly.
One of the main strengths of this tool is its multi timeframe analysis.
It evaluates market direction across intraday, daily, and higher timeframes, allowing traders to spot alignment or conflict between short term and long term trends.
The indicator focuses on a curated list of major currency pairs with reliable liquidity.
Traders often use it as a directional filter before applying their preferred entry strategy on individual charts.
Free Download
Download the “extreme-hook.mq4” MT4 indicator
Key Features
- Dashboard display showing bullish and bearish market conditions.
- CCI based trend detection using extreme value logic.
- Multi timeframe analysis from M1 up to monthly charts.
- Monitors a predefined set of major currency pairs.
- Helps reduce chart switching and analysis time.
Indicator Chart
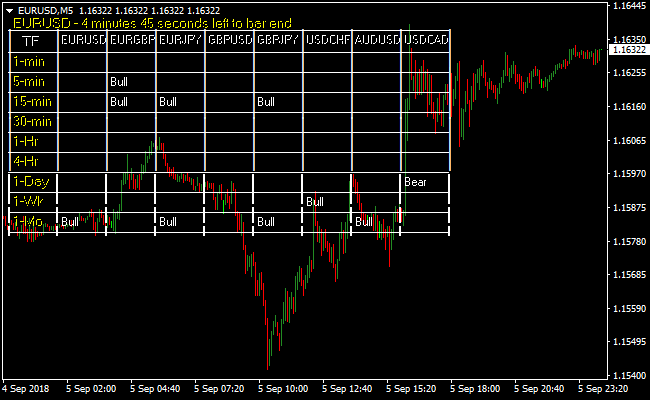
The chart below shows the dashboard window summarizing market direction across multiple timeframes.
Each row represents a currency pair, while columns reflect bullish or bearish bias based on CCI readings.

Guide to Trade with Bull Bear Signals Dashboard
Buy Rules
- Scan the dashboard for currency pairs marked as bull.
- Check that multiple lower timeframes align in bullish mode.
- Confirm the bullish bias on the trading chart.
- Look for buy entries using your preferred execution method.
Sell Rules
- Scan the dashboard for currency pairs marked as bear.
- Confirm bearish alignment across relevant timeframes.
- Validate the bearish bias on the price chart.
- Look for sell entries using your preferred execution method.
Stop Loss
- Place the stop loss just beyond the most recent swing high for sell trades or swing low for buy trades.
- Move the stop to breakeven once the trade moves in your favor by half your target distance.
Take Profit
- Close the trade when the dashboard shows the opposite signal (bull to bear or bear to bull).
- Take partial profits at key support or resistance levels for safer exits.
- Let trades run if multiple higher timeframes confirm the same trend.
Bull Bear Signals Dashboard and Cronex Impulse Forex Day Trading Strategy
This MT4 day trading strategy combines the market selection power of the Bull Bear Signals Dashboard MT4 Forex Indicator with the momentum confirmation of the Cronex Impulse MT4 Forex Indicator.
The purpose of this strategy is to help traders focus only on the strongest currency pairs and trade them with clear directional momentum.
The Bull Bear Signals Dashboard scans the market and shows whether each currency pair is trending bullish or bearish across multiple timeframes.
This removes guesswork and saves time by highlighting where opportunities are most likely to appear.
Bull signals indicate an upward trend and suggest buy opportunities while Bear signals indicate a downward trend and suggest sell opportunities.
The Cronex Impulse indicator is used directly on the chart to define precise entries and exits.
Its histogram reflects market momentum and provides objective confirmation for trade timing.
This strategy works best on the M15 and M30 charts with confirmation from the H1 timeframe.
It is suitable for day traders who prefer structured rules and want to avoid holding trades overnight.
Buy Entry Rules
- The currency pair must show Bull signals on the Bull Bear Signals Dashboard for M15, M30, and H1.
- Avoid pairs with mixed Bull and Bear signals across these timeframes.
- Open the M15 or M30 chart of the selected pair and apply the Cronex Impulse indicator.
- Wait for the Cronex Impulse histogram to cross above the zero line.
- Enter a buy trade at the close of the candle where the histogram crosses above zero.
- Place the stop loss below the most recent intraday swing low.
- Keep the buy trade open while the histogram remains above the zero line.
- Close the buy trade immediately when the histogram reverses and crosses back below the zero line.
Sell Entry Rules
- The currency pair must show Bear signals on the Bull Bear Signals Dashboard for M15, M30, and H1.
- Avoid pairs with conflicting signals across these timeframes.
- Open the M15 or M30 chart of the selected pair and apply the Cronex Impulse indicator.
- Wait for the Cronex Impulse histogram to cross below the zero line.
- Enter a sell trade at the close of the candle where the histogram crosses below zero.
- Place the stop loss above the most recent intraday swing high.
- Keep the sell trade open while the histogram remains below the zero line.
- Close the sell trade immediately when the histogram reverses and crosses back above the zero line.
Advantages
- Identifies strong trading opportunities using a clear multi-timeframe dashboard.
- Reduces time spent scanning charts and analyzing weak setups.
- Momentum-based exits allow profitable trades to develop naturally.
Drawbacks
- Histogram reversals can occur quickly during choppy price action.
- Requires patience to wait for full dashboard alignment.
Case Study 1
During the London session, EURAUD showed consistent Bull signals on the Bull Bear Signals Dashboard across the M15, M30, and H1 timeframes.
On the M15 chart, the Cronex Impulse histogram crossed above zero after a controlled pullback.
A buy trade was entered and held as long as the histogram stayed above zero.
Later in the session, the histogram crossed back below zero and the trade was closed, securing a clean intraday profit.
Case Study 2
During the New York session, USDCHF displayed Bear signals across all required intraday timeframes on the dashboard.
On the M30 chart, the Cronex Impulse histogram crossed below zero following a brief consolidation.
A sell trade was opened and held while bearish momentum remained intact.
When the histogram crossed back above zero, the position was closed, capturing the bulk of the intraday move.
Strategy Tips
- Use the Bull Bear Signals Dashboard as the first filter before opening any charts.
- Trade only pairs that show clear and consistent directional bias.
- Focus on the London and New York sessions for stronger momentum.
- Avoid entering trades late after extended impulsive moves.
- Close all trades before the end of the trading day to avoid overnight exposure.
- Pay close attention to histogram behavior for timely and disciplined exits.
Download Now
Download the “extreme-hook.mq4” Metatrader 4 indicator
FAQ
Which timeframes does the dashboard analyze?
The indicator evaluates market direction on M1, M5, M15, M30, H1, H4, daily, weekly, and monthly charts.
How reliable are the CCI extreme levels?
The default -100 and 100 levels capture momentum extremes. Traders may adjust these values to suit different volatility conditions.
Is the dashboard meant to replace chart analysis?
No, it acts as a directional filter. Trade entries should still be confirmed on the price chart.
Summary
The Bull Bear Signals Dashboard simplifies market scanning by highlighting bullish and bearish currency pairs in one view.
Its multi timeframe CCI logic helps traders focus on pairs that already show directional momentum.
For those who prefer scanning first and trading second, this dashboard offers a structured way to stay aligned with market direction.


