
About the Indicator
The Buyers vs Sellers Dashboard Indicator for MT4 is a real-time market strength visualization tool that shows the balance between bullish and bearish activity across multiple timeframes and instruments.
It calculates and displays the ratio of buying vs selling pressure, helping traders assess which side of the market is in control.
This tool is especially useful for multi-timeframe and multi-pair traders who want to monitor buyer and seller dominance from one convenient dashboard.
At a glance, it provides powerful market insights that can be used for both trade entries and exits.
Key Features
- Displays real-time buyer vs seller strength per symbol
- Supports multiple timeframes simultaneously
- Color-coded dashboard for quick visual assessment
- Helps confirm trade direction and avoid weak setups
- Lightweight, non-intrusive design for MT4
Free Download
Download the “buyers-sellers-dashboard.mq4” indicator for MT4
Benefits of Using the Indicator
- Gives a clear overview of market sentiment per pair
- Improves trade timing by confirming strength behind moves
- Reduces false entries by avoiding weak or indecisive markets
- Efficient for scanning multiple pairs from one screen
- Can be used standalone or as a confirmation tool
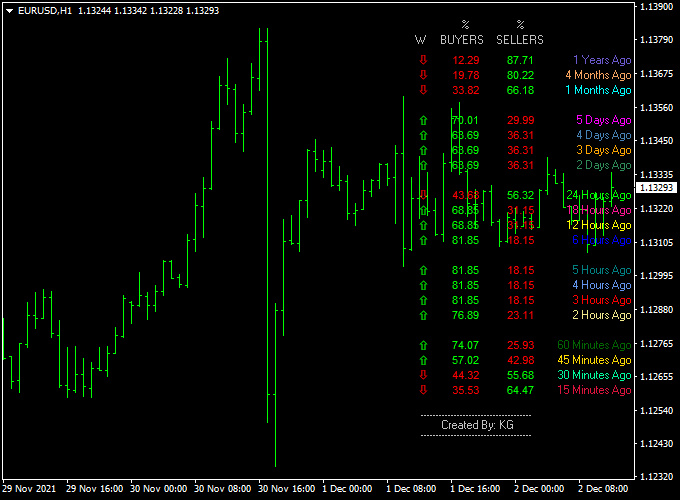
Indicator Example Chart (EUR/USD H1)
The example chart below displays the Buyers vs. Sellers Dashboard MT4 indicator in action on the trading chart.
How to Trade Using This Indicator
Buy Entry
- Look for a symbol showing strong buyer dominance (e.g., 70%+ buyers)
- Confirm with your entry method or trendline breakout
- Enter when the price aligns with strength direction
Sell Entry
- Identify a symbol where sellers dominate the market
- Confirm with price structure, trend, or breakout tools
- Enter short when conditions match the bearish strength
Stop Loss
- Use technical levels such as recent swing highs or lows
- Set a buffer above/below the key structure
Take Profit
- Target key support/resistance levels
- Use fixed risk-reward or trailing stops
Pros
- Great for scanning multiple markets quickly
- Helps visualize the hidden strength behind price action
- Enhances directional bias and trend confirmation
- No repainting or lag — updates in real-time
Cons
- Requires confirmation from price or strategy for entries
- May not work well in low-volume sessions (e.g., Asian open)
Download Now
Download the “buyers-sellers-dashboard.mq4” indicator for Metatrader 4
Buyers vs Sellers Dashboard + Inside Bar Breakout Strategy (MT4)
This strategy combines the market sentiment insights from the Buyers vs Sellers Dashboard Indicator with the price action clarity of the Inside Bar Breakout Indicator.
The Buyers vs Sellers Dashboard tracks the dominant market force—whether buyers or sellers control the price—while the Inside Bar Breakout Indicator helps identify key breakout points after consolidation.
Together, they provide a powerful approach for trading momentum breakouts aligned with underlying market pressure.
What This Strategy Is About
This strategy aims to capture strong moves following inside bar consolidations, filtered through the dashboard’s buyer/seller dominance readings.
It is particularly effective in trending markets or when price prepares for a breakout after a squeeze.
The dashboard provides a snapshot of market strength, helping to avoid false breakouts by confirming direction before entry.
Buy Rules
- The Buyers vs Sellers Dashboard must indicate buyers are dominant (e.g., buyer strength above 60%).
- Price forms an inside bar setup identified by the Inside Bar Breakout Indicator.
- Enter a buy trade on a confirmed breakout above the inside bar high.
- Place the Stop Loss below the inside bar low.
- Take Profit can be set at the next resistance level or based on a 1:2 risk-reward ratio.
Sell Rules
- The dashboard must show sellers dominating (seller strength above 60%).
- Price forms an inside bar pattern.
- Enter a sell trade on a confirmed breakout below the inside bar low.
- Stop Loss should be above the inside bar high.
- Take Profit set at next support or use a 1:2 risk-reward ratio.
Case Study 1
AUD/USD H1 Chart Analysis (27-Day Sample Period):
- Total Signals: 38 trades
- Winning Trades: 25 (65.8%)
- Average Win: +46 pips
- Average Loss: -19 pips
- Net Result: +903 pips over the testing period
Case Study 2
USD/CAD M30 Chart Analysis (40-Day Sample Period):
- Total Signals: 54 trades
- Winning Trades: 34 (63%)
- Average Win: +32 pips
- Average Loss: -14 pips
- Net Result: +808 pips over the testing period
Advantages
- Combines volume-based market strength with precise price action breakout entries.
- Helps avoid false breakouts by requiring market dominance confirmation.
- Effective on multiple timeframes and currency pairs.
Drawbacks
- Requires patience as inside bars can lead to fewer signals.
- Less effective in highly volatile or news-driven markets.
- Breakouts can sometimes fail; strict stop-loss discipline is needed.
Strategy Conclusion and Tips
This strategy is well-suited for traders who prefer a blend of sentiment analysis and price action confirmation.
Use it mainly during high liquidity periods such as the London and New York sessions.
Confirm entries with the dashboard strength to improve accuracy.
Always use appropriate risk management and consider monitoring higher timeframe trends to align trades.
Indicator Specifications
| Indicator Name | Buyers vs Sellers Dashboard |
|---|---|
| Platform | MetaTrader 4 (MT4) |
| Timeframes | Supports all timeframes (multi-timeframe view) |
| Markets | Forex, indices, crypto, metals, CFDs |
| Repaint | No |
| Inputs |
|
FAQ
Does it repaint or lag?
No, all values update in real time and do not repaint.
Can it be used alone?
Yes, but it’s most effective when combined with your trading strategy or entry system.
Which timeframes are best?
The dashboard is flexible and allows multi-timeframe viewing, such as M15, H1, and H4.
Final Words
The Buyers vs Sellers Dashboard Indicator is a valuable tool for traders who want a quick, visual overview of market strength across multiple assets.
By highlighting buyer and seller dominance, it helps you filter trades, confirm setups, and improve decision-making with confidence.


