About the Camarilla Breakout Indicator
The Camarilla Breakout Indicator for MT4 is a sophisticated mathematical tool used by professional traders to identify high-probability price levels based on daily volatility.
It utilizes the Camarilla pivot point formula, which calculates multiple levels of support and resistance that often act as significant barriers for price action.
Unlike standard pivots, this indicator places a heavy emphasis on the “H4” and “L4” levels, which are widely recognized as the ultimate breakout points for any given trading session.
When price breaches these zones, it often signals the start of a powerful directional move as market participants adjust their positions.
It is an essential utility for breakout traders who want to capitalize on volatility spikes while maintaining a structured approach to entry and exit points.
Free Download
Download the “camarilla.mq4” MT4 indicator
Key Features
- Automatically calculates and displays critical Camarilla pivot levels on the MT4 chart.
- Identifies precise breakout zones for both long and short trading opportunities.
- Provides pre-defined profit targets based on historical volatility expansion.
- Helps traders distinguish between ranging price action and true market breakouts.
- Works seamlessly across all currency pairs and liquid assets.
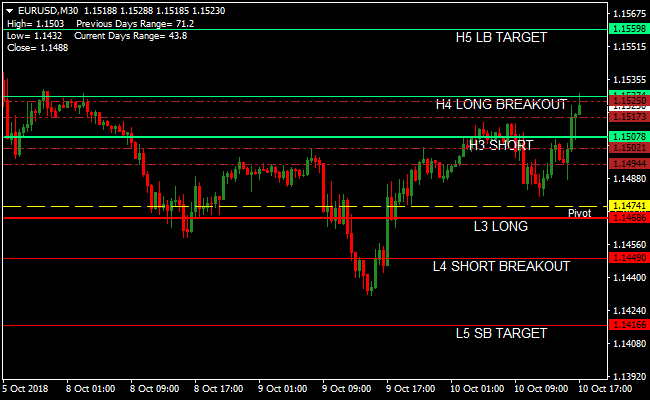
Indicator Chart
The Camarilla Breakout Indicator displays a series of horizontal lines representing different support and resistance tiers.
The most vital markers are the H4 Long Breakout and L4 Short Breakout levels.
When price pushes through the H4 level, the chart indicates a shift into a bullish breakout phase.
Conversely, a drop below the L4 level suggests a bearish breakout is underway.

Guide to Trade with Camarilla Breakout Indicator
Buy Rules
- Monitor the price as it approaches the H4 Long Breakout level from below.
- Open a buy trade immediately when the price touches or closes above the H4 line.
- Ensure there is sufficient market volume to support a sustained upward move.
- Confirm the breakout is not a simple stop-run by checking the candle close on your preferred timeframe.
Sell Rules
- Watch for price action to decline toward the L4 Short Breakout level from above.
- Execute a sell order as soon as the price touches the L4 level.
- Verify that the broader market sentiment aligns with a bearish breakout.
- Look for a decisive break of the level to ensure the momentum is strong enough to reach the target.
Stop Loss
- Place the stop loss below the H3 level for long breakout trades.
- Position the stop loss above the L3 level for short breakout trades.
- Maintain a stop that protects against a failed breakout and a return to the daily range.
Take Profit
- Set the take profit for buy trades at the H5 LB Target price level.
- Target the L5 SB Target price level for all sell breakout positions.
- Consider closing a portion of the trade if the price stalls near the initial breakout zone.
Camarilla Breakout + ASC Trend Forex Day Trading Strategy
This MT4 day trading strategy combines breakout levels from the Camarilla Breakout MT4 indicator with precise entry signals from the ASC Trend MT4 indicator.
It is designed for day traders and works best on M15, M30, or H1 charts.
The strategy identifies potential breakout opportunities using the H4 Long Breakout and L4 Short Breakout levels and confirms entries with ASC Trend arrows.
This combination ensures that you trade in the direction of strong momentum while avoiding false breakout attempts.
Buy Entry Rules
- Price must touch the H4 Long Breakout level on the Camarilla Breakout indicator.
- Wait for an Aqua arrow from ASC Trend indicating a buy signal.
- Enter a buy position at the next candle open after both conditions are met.
- Place a stop loss a few pips below the H4 Long Breakout level or recent swing low.
- Set take profit at 1.5 times the 14-period ATR from the entry price. This adapts the target to current market volatility and captures the main breakout move.
Sell Entry Rules
- Price must touch the L4 Short Breakout level on the Camarilla Breakout indicator.
- Wait for a Magenta arrow from ASC Trend indicating a sell signal.
- Enter a sell position at the next candle open after both conditions are met.
- Place a stop loss a few pips above the L4 Short Breakout level or recent swing high.
- Set take profit at 1.5 times the 14-period ATR below the entry price to adapt to current volatility and capture the breakout move.
Advantages
- Combines breakout levels with confirmed momentum signals for higher probability trades.
- ATR-based take profit adapts to market conditions, improving risk-reward balance.
- Suitable for multiple intraday timeframes, providing flexibility for different trading styles.
- Reduces false breakouts by requiring confirmation from ASC Trend arrows.
Drawbacks
- Breakouts can fail, resulting in stop loss hits if momentum reverses quickly.
- Requires active monitoring during the trading session, especially around key breakout levels.
- Short-term volatility spikes can trigger the stop loss before the trade moves in your favor.
- Not suitable for illiquid or thinly traded pairs due to irregular price movements.
Case Study 1 — EUR/USD, M30
The price touched the H4 Long Breakout level on the Camarilla Breakout indicator.
Shortly after, an Aqua arrow appeared from ASC Trend confirming a buy.
Entered at 1.1080, stop loss placed at 1.1065. ATR (14) was 10 pips, so the take profit was set at 1.1095 (1.5 × ATR).
Price reached take profit within 45 minutes for a net gain of 15 pips.
Case Study 2 — GBP/JPY, H1
The price touched the L4 Short Breakout level on the Camarilla Breakout indicator.
A Magenta arrow appeared from the ASC Trend indicator confirming a sell.
Entered at 169.50, stop loss at 169.75. ATR (14) was 20 pips, so the take profit was set at 169.20 (1.5 × ATR).
The trade captured 30 pips over two hours.
Strategy Tips
- Focus on pairs with clear liquidity and minimal spreads during your preferred trading session.
- Combine breakout levels with nearby support and resistance zones to identify stronger entry points.
- Consider waiting for the candle to close above H4 Long Breakout or below L4 Short Breakout to reduce false breakout signals.
- Adjust stop loss distance based on ATR to adapt to current market volatility.
- Consider scaling out partial profits if the trend is strong, moving the stop loss to breakeven on the remaining position.
- Combine with trend strength indicators or volume filters to confirm the breakout momentum before entry.
- Do not chase trades; only enter when both the breakout level and ASC Trend signal align.
Download Now
Download the “camarilla.mq4” Metatrader 4 indicator
FAQ
What makes Camarilla pivots different from standard floor pivots?
Camarilla pivots use a different multiplier that focuses on the previous day’s range.
This often results in much tighter levels that are highly effective for day trading.
While standard pivots are great for general support and resistance, the Camarilla Breakout Indicator is specifically tuned to find the exact price point where a range turns into a trending breakout.
Which timeframes work best for the Camarilla Breakout Indicator?
This indicator is primarily designed for intraday trading, so it is most effective on the M5, M15, and H1 timeframes.
Because the levels are calculated based on the previous day’s data, they reset every 24 hours.
Using it on these shorter timeframes allows you to catch the breakout as it happens during the London or New York sessions.
Does this indicator work during low-volatility news events?
The Camarilla Breakout Indicator is actually very useful during news events because it provides objective levels to watch.
If news causes a spike, the H4 and L4 levels tell you if that spike has enough merit to become a new trend.
However, always be cautious of widened spreads and slippage during high-impact data releases.
Summary
The Camarilla Breakout Indicator provides an objective and mathematically sound way to trade market volatility.
By identifying the specific levels where price is likely to break its daily range, it gives traders a significant edge in timing their entries.
The inclusion of clear targets like H5 and L5 makes it a complete system for managing trades from start to finish.
Integrating this tool into your daily routine will help you avoid overtrading within the noise of the central range.
By waiting for the H4 or L4 levels to be challenged, you ensure that you are only entering the market when there is a high probability of a sustained move.


