About the CCI MTF Signals Indicator
The CCI MTF Signals indicator for MT4 provides traders with buy and sell arrow alerts based on CCI extremes and other customizable inputs.
It works across multiple timeframes, making it suitable for scalping, intraday, and short-term trading strategies.
Aqua arrows signal potential buy trades, while red arrows signal potential sell trades.
The indicator also displays trend bias with colored histogram bars in a separate window, giving a visual guide of bullish or bearish momentum.
The default CCI period is set to 14 but can be modified in the inputs menu to suit different trading instruments and styles.
The indicator provides multiple trade opportunities throughout the day and helps traders act quickly on short-term trend reversals.
Free Download
Download the “cci-mtf-advanced-alerts.mq4” MT4 indicator
Key Features
- Buy and sell arrows generated from CCI extremes.
- Colored histogram bars show the short-term trend bias.
- Adjustable CCI period and input settings for customization.
- Ideal for scalping and day trading with multiple signals per session.
- Separate window display for clear visualization of momentum and signals.
Indicator Chart
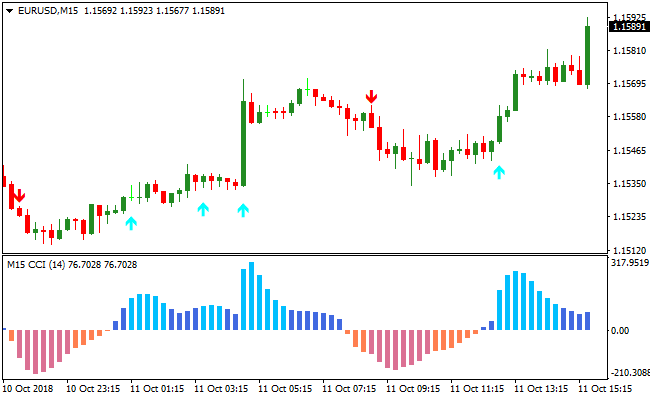
The image below shows the CCI MTF Signals indicator displayed in a separate window beneath the main price chart.
Aqua arrows indicate buy signals and red arrows indicate sell signals, while the histogram bars show the short-term trend bias.
Traders can use these signals to enter trades in alignment with momentum and the overall trend.

Guide to Trade with the CCI MTF Signals Indicator
Buy Rules
- Open a buy trade when the indicator draws an aqua arrow.
- Confirm that the histogram bars are green, indicating a bullish trend bias.
- Preferably trade in alignment with the overall market trend using a trend-following tool.
- Ignore buy signals if momentum is weak or the histogram shows mixed bias.
Sell Rules
- Open a sell trade when the indicator draws a red arrow.
- Confirm that the histogram bars are red, indicating bearish trend bias.
- Preferably trade in alignment with the overall market trend using a trend-following tool.
- Ignore sell signals if momentum is weak or the histogram shows mixed bias.
Stop Loss
- For buy trades, place the stop loss just below the most recent swing low.
- For sell trades, place the stop loss just above the most recent swing high.
- Move the stop loss in the direction of the trade if momentum strengthens.
Take Profit
- Close buy trades if a red arrow appears or the histogram turns red.
- Close sell trades if an aqua arrow appears or the histogram turns blue.
CCI MTF Signals + Simpler Trend MT4 Forex Strategy
This MT4 strategy combines the CCI MTF Signals Indicator with the Simpler Trend Indicator to create a clear trend-following strategy.
The CCI MTF Signals Indicator provides visual entry signals: blue arrows indicate buy opportunities, while red arrows indicate sell opportunities.
The Simpler Trend Indicator confirms the trend using candlestick color patterns: a series of green candles indicates a bullish trend and a series of red candles indicates a bearish trend.
Combining precise entry signals with trend confirmation helps traders avoid counter-trend trades and capture high-probability moves.
This strategy works well on major currency pairs and can be used on M5, M15, and H1 charts.
Buy Entry Rules
- The Simpler Trend Indicator must show a series of green candles, indicating a bullish trend.
- A blue arrow appears on the CCI MTF Signals Indicator.
- Enter a buy trade at the close of the candle confirming the blue arrow.
- Place a stop loss below the recent swing low or the bottom of the green candle series.
- Take profit when the trend shows signs of weakening, such as a red candle appearing in the Simpler Trend Indicator or a red arrow from the CCI MTF Signals.
Sell Entry Rules
- The Simpler Trend Indicator must show a series of red candles, indicating a bearish trend.
- A red arrow appears on the CCI MTF Signals Indicator.
- Enter a sell trade at the close of the candle confirming the red arrow.
- Place a stop loss above the recent swing high or the top of the red candle series.
- Take profit when the trend shows signs of weakening, such as a green candle appearing in the Simpler Trend Indicator or a blue arrow from the CCI MTF Signals.
Advantages
- Clear entry and exit signals reduce confusion and improve decision-making.
- Trend confirmation reduces false counter-trend trades.
- Works well on multiple timeframes and currency pairs.
- Allows flexible exits based on trend strength instead of fixed pip targets.
Drawbacks
- Sudden price spikes can trigger stop losses before trend continuation.
- Monitoring multiple indicators can be demanding for less experienced traders.
Example Case Study 1 – EUR/USD M5
During the London session, EUR/USD showed a series of green candles on the Simpler Trend Indicator.
The CCI MTF Signals Indicator displayed a blue arrow at 1.0875.
A buy trade was entered at 1.0875 with a stop loss at 1.0865 below the recent swing low.
Price continued upward and the trade was closed at 1.0890 when the first red candle appeared in the Simpler Trend Indicator, yielding 15 pips.
Example Case Study 2 – GBP/JPY M15
GBP/JPY on the M15 chart during the New York session showed a series of red candles on the Simpler Trend Indicator.
A red arrow appeared on the CCI MTF Signals Indicator at 152.35.
A sell trade was opened at 152.35 with a stop loss at 152.50 above the recent swing high.
Price moved downward and the trade was closed at 152.10 when a green candle appeared, capturing 25 pips.
Strategy Tips
- Use major currency pairs for smoother execution and reliable trends.
- Focus on M5, M15, and H1 charts for short- and medium-term trades.
- Do not enter trades if the arrow signal conflicts with the trend color on the Simpler Trend Indicator.
- Use dynamic take profit based on trend exhaustion rather than fixed pip targets.
Download Now
Download the “cci-mtf-advanced-alerts.mq4” Metatrader 4 indicator
FAQ
Is the CCI period adjustable?
Yes, the default period is 14 but it can be modified in the inputs menu to fit different currency pairs and trading styles.
How reliable are the arrows?
The arrows provide clear entry signals. Accuracy improves when trades align with the histogram trend bias and the overall market direction.
Summary
The CCI MTF Signals indicator offers clear buy and sell arrow alerts combined with a colored histogram showing short-term trend bias.
It helps traders identify high-probability entries for scalping and day trading while keeping trade decisions simple and visual.
By using the arrows with the histogram and optional trend filters, traders can improve accuracy, manage risk effectively, and confidently capture short-term market opportunities.


