About the indicator
The Chaikin Money Flow (CMF) is a volume-weighted oscillator that shows whether money is flowing into (accumulation) or out of (distribution) a security.
Built on the relationship between price and volume, CMF helps traders confirm trends, spot divergences, and identify potential reversals.
The MT4 version included here is easy to attach to any chart, configurable, and designed for intraday and swing trading.
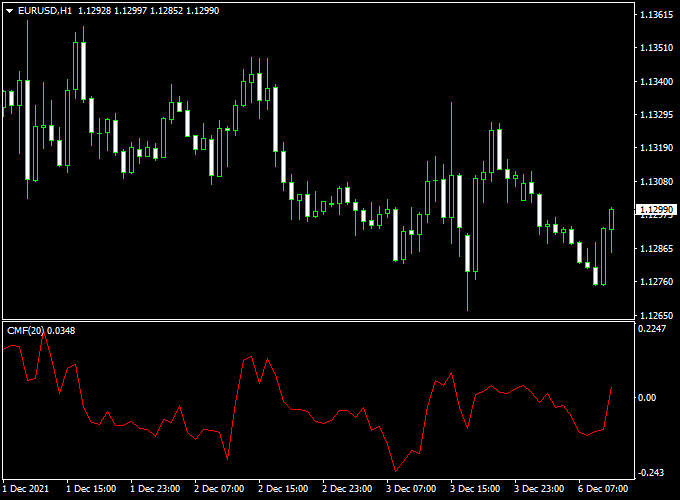
The indicator gets displayed in a separate MT4 chart window as a red oscillator signal line.
Key Points
- The trend is bullish when the Chaikin Money Flow red signal line is trading above the 0.00 level.
- The trend is bearish when the Chaikin Money Flow red signal line is trading below the 0.00 level.
Key features
- Volume-weighted oscillator — measures accumulation vs distribution.
- Clear zero line and optional threshold levels for overbought/oversold zones.
- Adjustable lookback period (default 20) to adapt to different timeframes.
- Histogram and line display modes for easier visual interpretation.
Free Download
Download the “chaikin-money-flow-indicator.mq4” indicator for MT4
Benefits of using the indicator
- Confirms price trends by adding the volume dimension — helps avoid false breakouts.
- Spot divergences: price making new highs while CMF fails to confirm is an early warning.
- Works across timeframes — from M1 scalps to daily swing trades.
- Improves risk management when combined with support/resistance and trend filters.
Indicator Example Chart (EUR/USD H1)
The chart example below showcases the Chaikin Money Flow MT4 indicator applied to a live trading setup.

How to trade using this indicator
Buy Entry
- Trend filter: price above EMA200 (H1 or your preferred timeframe).
- CMF crosses above 0 (or above +0.05 threshold) after a pullback.
- Confirm with bullish price action (bullish engulfing, pin bar) or support level.
Sell Entry
- Trend filter: price below EMA200.
- CMF crosses below 0 (or below −0.05) after a rally.
- Confirm with bearish price action or a resistance zone.
Stop loss & take profit
- Stop loss: place below the recent swing low (buys) or above the swing high (sells). For intraday trades, a volatility-based ATR(14) × 1.2–1.5 is a good guide.
- Take profit: aim for 1.5–3× the risk (R:R 1:1.5 to 1:3) or target the next structural level (support/resistance).
- Alternatively, use trailing stops once the trade is in profit to capture extended moves while protecting gains.
Download Now
Download the “chaikin-money-flow-indicator.mq4” indicator for Metatrader 4
Chaikin Money Flow + Auto Fibonacci Strategy for MT4
What Is This Strategy About?
This strategy merges volume-based momentum from the Chaikin Money Flow Indicator (CMF) with dynamic support and resistance levels generated by the Auto Fibonacci Retracement Indicator.
The CMF tracks whether capital is flowing in or out of an asset based on volume and price, while Fibonacci retracement levels help pinpoint key reversal zones.
When used together, this combo helps identify momentum-backed bounce trades off Fibonacci levels in trending markets.
Buy Rules
- Wait for price to approach a major Fibonacci support level (38.2%, 50%, or 61.8%).
- Confirm that the CMF Indicator is above the 0 line and rising – indicating strong buying pressure.
- Enter a long trade when a bullish candle forms off the Fibonacci level, confirming the reversal.
- Set stop loss just below the nearest swing low or below the 78.6% Fib level.
- Take profit at the 23.6% or 0% Fib extension or previous resistance.
Sell Rules
- Wait for price to approach a major Fibonacci resistance level (38.2%, 50%, or 61.8%).
- Confirm that CMF is below the 0 line and declining – showing increasing selling pressure.
- Enter a short trade when a bearish candle forms off the Fibonacci level.
- Set stop loss just above the nearest swing high or above the 78.6% Fib level.
- Take profit at the 23.6% or 0% Fib level or recent support zone.
Case Study 1: EUR/JPY M30 Chart Analysis (Sample Period)
- Total Signals: 47 trades
- Winning Trades: 30 (63.8%)
- Average Win: +25.2 pips
- Average Loss: -15 pips
- Net Result: +501 pips over the testing period
Case Study 2: NZD/USD H1 Chart Analysis (Sample Period)
- Total Signals: 25 trades
- Winning Trades: 17 (68%)
- Average Win: +38.5 pips
- Average Loss: -22 pips
- Net Result: +478 pips over the testing period
Advantages
- Combines price structure with volume-based confirmation.
- Auto Fibo tool reduces manual drawing errors.
- CMF helps avoid false reversals at Fibonacci levels.
- Adaptable to trending and ranging markets.
Drawbacks
- Chaikin Money Flow may lag during sudden reversals.
- Fibonacci levels may overlap with news-related volatility zones.
- Strategy requires patience and confluence to execute effectively.
Strategy Conclusion and Tips
This strategy works best when price reacts to key Fibonacci retracement levels and CMF confirms the underlying momentum.
It’s ideal for traders who want to catch pullbacks in trending markets without relying purely on price action.
Use this strategy on timeframes from M30 to H1 for optimal performance.
- Combine with candlestick reversal patterns for stronger entries.
- Don’t trade near major news events to avoid whipsaws.
- Always use proper risk management, aiming for a risk-to-reward of at least 1:1.5.
Indicator specifications
Below are the most important fields and default inputs for the MT4 version.
| Indicator | Chaikin Money Flow (CMF) — MT4 |
| Type | Oscillator (volume-weighted) |
| Default Period | 20 |
| Display modes | Line, Histogram |
| Levels | Zero line, optional +0.05 / −0.05 thresholds |
| Inputs |
|
| Compatible | MT4 (Windows), printable on VPS setups |
FAQ
Which timeframe works best?
CMF works well on H1, H4, and Daily for swing trades; M15–M30 can be used for intraday scalps. Adjust the period to taste (shorter for lower timeframes).
Can I use CMF alone?
CMF is strongest when combined with trend filters (EMA200), price action, or support/resistance. Using it alone increases the chance of false signals.
What inputs should I start with?
Start with Period = 20 and typical price. Test adjusted thresholds like ±0.05 if you want fewer but higher-quality signals.
Final words
The Chaikin Money Flow MT4 indicator is a practical, volume-aware tool that helps you confirm moves and spot early divergence signals.
Download it for free, test the strategy in a demo, and combine CMF with trend and price-action filters for the best results.
Remember: always use a stop loss and manage risk because no indicator is perfect.


