About the Chaikin Oscillator (MT4)
The Chaikin Oscillator is a momentum tool that measures the difference between two moving averages of the Accumulation/Distribution Line.
It blends price action with volume to help traders spot shifts in buying or selling pressure before they become obvious on the chart.
In MT4, it’s easy to set up and works well for intraday and swing trading.
The indicator gets displayed in a separate MT4 chart window in the form of a blue oscillator signal line that oscillates above and below the 0.00 neutral level.
Key Points
- The trend is bullish when the Chaikin Oscillator blue signal line is trading above the 0.00 level.
- The trend is bearish when the Chaikin Oscillator blue signal line is trading below the 0.00 level.
The Chaikin Oscillator indicator can be used for both entry and exit signals or to confirm buy & sell trade setups issued by your favorite trading systems or strategies.
Free Download
Download the “chaikin-oscillator.mq4” indicator for MT4
Benefits of Using the Indicator
- Confirms the strength of price moves by adding a volume perspective.
- Helps detect early momentum changes before price reacts.
- It can be applied to any market or timeframe.
- Works well with trend filters and price action.
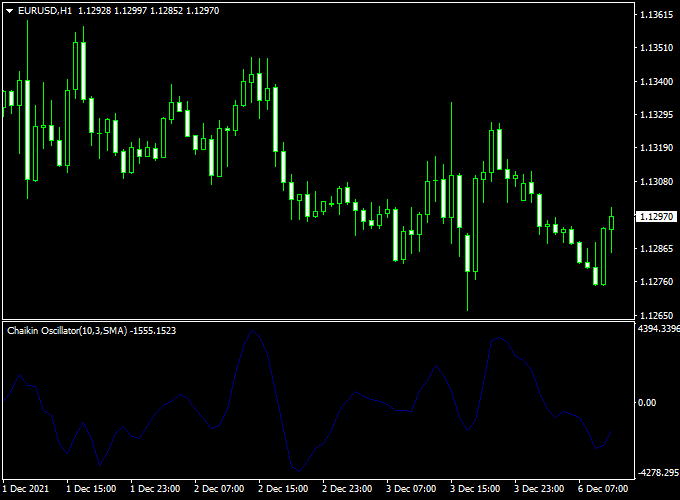
Indicator Example Chart (EUR/USD H1)
The chart example below shows the Chaikin Oscillator in action on a trading setup, highlighting how momentum changes appear in real market conditions.

How to Trade Using This Indicator
Here’s a straightforward approach to using the Chaikin Oscillator in MT4:
Buy Setup
- Trend filter: price above EMA100.
- Oscillator crosses above zero after a pullback.
- Confirm with bullish candlestick patterns or a bounce from support.
Sell Setup
- Trend filter: price below EMA100.
- Oscillator crosses below zero after a rally.
- Confirm with bearish candlestick patterns or resistance rejection.
Stop Loss & Take Profit
- Stop Loss: Place beyond the recent swing high/low.
- Take Profit: Aim for 1.5–3 times your risk or the next key market level.
- Consider using a trailing stop once the price moves in your favor.
Download Now
Download the “chaikin-oscillator.mq4” indicator for Metatrader 4
Chaikin Oscillator + Parabolic SAR Strategy for MT4
What Is This Strategy About?
This strategy combines volume momentum analysis from the Chaikin Oscillator Indicator with the trend-following entries provided by the Parabolic SAR Indicator for MT4.
The Chaikin Oscillator helps identify surges in buying or selling pressure based on the accumulation/distribution line and moving averages, while the Parabolic SAR provides dynamic trailing stop and reversal points.
This combination is useful for trading trend continuations with volume confirmation.
Buy Rules
- The Chaikin Oscillator must be above the zero line and rising – indicating buying momentum.
- The Parabolic SAR dots must appear below the price – signaling an uptrend.
- Enter a long trade when both conditions align and the price makes a higher high.
- Place a stop loss just below the most recent SAR dot.
- Take profit at a risk/reward ratio of 1:2 or use SAR dots for trailing exit.
Sell Rules
- Chaikin Oscillator must be below the zero line and falling – showing selling pressure.
- Parabolic SAR dots must be above the price, indicating a downtrend.
- Enter a short trade when the price breaks a recent low under both conditions.
- Stop loss goes just above the last SAR dot.
- Use SAR trail or fixed profit target based on support levels.
Case Study 1: USD/CAD M30 Chart Analysis (Sample Period)
- Total Signals: 50 trades
- Winning Trades: 32 (64%)
- Average Win: +23.9 pips
- Average Loss: -14 pips
- Net Result: +514 pips over the testing period
Case Study 2: GBP/CHF H1 Chart Analysis (Sample Period)
- Total Signals: 27 trades
- Winning Trades: 18 (66.7%)
- Average Win: +36.5 pips
- Average Loss: -20 pips
- Net Result: +476 pips over the testing period
Advantages
- Combines volume momentum with trend-following logic.
- Easy-to-read entry and exit signals with Parabolic SAR.
- Works well on intraday and swing trading timeframes (M30–H1).
- Helps filter out low-momentum fakeouts using Chaikin.
Drawbacks
- Chaikin Oscillator may lag during high volatility periods.
- Parabolic SAR can produce whipsaws in sideways markets.
- Requires filtering trades with strong price action confirmation.
Strategy Conclusion and Tips
The Chaikin + Parabolic SAR strategy provides strong momentum-trend confirmation and helps traders stay in the market during sustained moves.
It works best on moderately volatile pairs and clear trends. For best results:
- Use the strategy only when both indicators agree.
- Skip trades during low-volume sessions or consolidation periods.
- Test the system across different timeframes and pairs on demo first.
Indicator Specifications
| Indicator | Chaikin Oscillator (MT4) |
| Type | Volume–momentum oscillator |
| Fast EMA | 3 (default) |
| Slow EMA | 10 (default) |
| Display Modes | Histogram, Line |
| Levels | Zero line, optional thresholds |
| Inputs |
|
| Compatibility | MetaTrader 4 |
FAQ
Which timeframe is best?
It works on all timeframes, but H1 and H4 are popular for swing trading. For scalping, try M15 or M30.
Can I use it alone?
It’s better used with a trend filter like EMA200 or support/resistance analysis to avoid false signals.
Final Words
The Chaikin Oscillator MT4 is a practical, volume-based momentum indicator that helps confirm trends and spot reversals early.
Download it free, test it on a demo, and pair it with your preferred strategy for the best results.


