
About the Chaikin Volatility Forex Indicator (MT4)
The Chaikin Volatility Forex Indicator (MT4) measures the volatility of a currency pair by comparing the spread between high and low prices over a specific period.
It’s based on the principles developed by Marc Chaikin and is particularly useful for identifying market conditions where price movement is accelerating or slowing down.
This makes it a valuable tool for traders looking to spot breakout opportunities or prepare for trend reversals.
Main Features
- Measures volatility changes based on high-low price differentials.
- Helps detect potential breakout setups.
- Customizable calculation period for flexibility.
- Works across all timeframes and currency pairs.
- Compatible with other technical indicators for confirmation.
Key Points
- High indicator readings suggest a highly volatile market.
- Low indicator readings suggest a low-volatility market.
Benefits of Using This Indicator
- Identifies early signs of market volatility shifts.
- Helps traders prepare for high-momentum moves.
- Can be used in both trending and ranging markets.
- Simple to read and interpret on the chart.
Free Download
Download the “chaikins-volatility.mq4” indicator for MT4
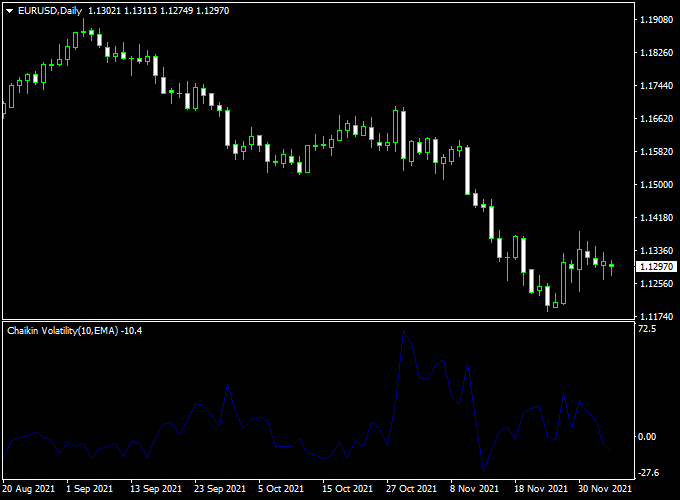
Indicator Example Chart (EUR/USD Daily)
The example chart below showcases the Chaikin Volatility indicator in action, highlighting periods of rising and falling volatility that can lead to strong trading opportunities.
How to Trade Using This Indicator
Buy Entry
- Wait for the Chaikin Volatility to rise sharply after a period of low volatility.
- Confirm with a bullish price breakout above recent resistance.
- Place your stop loss below the most recent swing low.
- Set your take profit based on the next key resistance or a fixed reward-to-risk ratio (e.g., 2:1).
Sell Entry
- Look for the Chaikin Volatility to spike following a low-volatility phase.
- Confirm with a bearish breakout below recent support.
- Place your stop loss above the most recent swing high.
- Set your take profit at the next key support or using a set risk/reward target.
Pros
- Helps spot potential market breakouts early.
- Works well in combination with trend indicators.
- Simple visual representation of volatility changes.
Cons
- Does not indicate direction—should be combined with other indicators.
- It may give false signals during choppy market conditions.
Download Now
Download the “chaikins-volatility.mq4” indicator for Metatrader 4
Tipu CCI + Chaikin Volatility Indicator MT4 Forex Strategy
Overview
This trading strategy uses the Tipu CCI Indicator to detect overbought and oversold market conditions and combines it with the Chaikin Volatility Indicator to confirm periods of increased market activity.
This duo helps traders identify high-probability entry points during moments of strong price momentum and expanding volatility.
Buy Trade Setup
- Tipu CCI histogram is blue.
- Chaikin Volatility is rising and above the zero line.
- Enter a buy trade on the next candle close that confirms both indicators.
- Stop Loss: Below the recent swing low or 20 pips (whichever is greater).
- Take Profit: Target 1.5x risk or exit when Tipu CCI drops below +100.
Sell Trade Setup
- Tipu CCI histogram is red.
- Chaikin Volatility is rising and above zero.
- Enter a sell trade after confirmation.
- Stop Loss: Above recent swing high or 20 pips.
- Take Profit: 1.5x risk or exit when Tipu CCI rises above -100.
Case Study 1: EUR/USD M15 Chart (Sample Period)
- Total Trades: 36
- Winning Trades: 22 (61.1%)
- Average Win: +18 pips
- Average Loss: -12 pips
- Net Result: +264 pips over the test period
Case Study 2: GBP/JPY H1 Chart (Sample Period)
- Total Trades: 28
- Winning Trades: 18 (64.3%)
- Average Win: +32 pips
- Average Loss: -19 pips
- Net Result: +403 pips over the test period
Advantages
- Combines trend momentum with real-time volatility confirmation.
- Filters out weak setups by requiring dual indicator alignment.
- Adaptable to multiple timeframes and currency pairs.
Disadvantages
- Fewer setups in low-volatility or sideways markets.
- False signals can occur without strict confirmation.
- Requires consistent monitoring for signal confirmation.
Strategy Conclusion
Using the Tipu CCI and Chaikin Volatility Indicator together creates a high-quality setup for traders who want to avoid flat or uncertain market phases.
This strategy works best during high-volume sessions and trending environments.
Always backtest before applying it to live trades, and consider adjusting stop-loss and target levels depending on the currency pair’s volatility.
Indicator Specifications
| Indicator Name | Chaikin Volatility Forex Indicator |
|---|---|
| Platform | MetaTrader 4 (MT4) |
| Timeframes | All |
| Currency Pairs | All |
| Inputs | Period (default: 10) |
FAQ
Can I use this indicator on any Forex pair?
Yes, the Chaikin Volatility indicator works on all currency pairs and timeframes.
Is it better for day trading or swing trading?
It works well for both. Short-term traders can use it to anticipate intraday breakouts, while swing traders can prepare for larger moves.
Do I need other indicators to use it effectively?
Yes, it’s best used alongside trend or momentum indicators to confirm trade direction.
Final Words
The Chaikin Volatility Forex Indicator (MT4) is an excellent tool for identifying when market conditions are likely to change.
By spotting shifts in volatility early, traders can prepare for profitable opportunities.
Combine it with strong trend analysis for maximum accuracy, and always use proper risk management.


