About the CoeffofLine Histogram Indicator
The CoeffofLine Histogram for MetaTrader 4 visualizes changes in price direction as a color-changing histogram beneath your chart.
It measures the “line coefficient” (a slope-like momentum reading) to show when momentum strengthens, fades, or flips.
Traders use it to confirm trends, spot early reversals, and filter out whipsaws during ranging markets.
Key Features
- Color-coded histogram for quick trend / no-trend confirmation.
- Adaptive sensitivity via period and smoothing inputs.
- Zero-line cross flips to signal potential entries/exits.
- Works across timeframes (scalping to swing) and major FX pairs, indices, and metals.
- Lightweight & efficient—ideal for multi-chart setups.
The indicator appears as a blue colored histogram in a separate MT4 chart window.
Key Points
- A bullish trend occurs whenever the blue histogram bars cross the 0.00 level upwards.
- A bearish trend occurs whenever the blue histogram bars cross the 0.00 level downwards.
The CoeffofLine Histogram indicator can be used for both entry and exit signals or to confirm buy & sell trade setups issued by your favorite trading systems or strategies.
The indicator works equally well on all assets (Forex, CFD stocks, Indices, Cryptocurrencies, Commodities, etc.) and shows promising results when used correctly.
Free Download
Download the “CoeffofLine.mq4” indicator for MT4
Benefits of Using This Indicator
- Clarity: Condenses momentum and direction into one clean pane.
- Versatility: Use standalone or as a trend filter for any system.
- Timing: Early warnings on momentum fade before price turns.
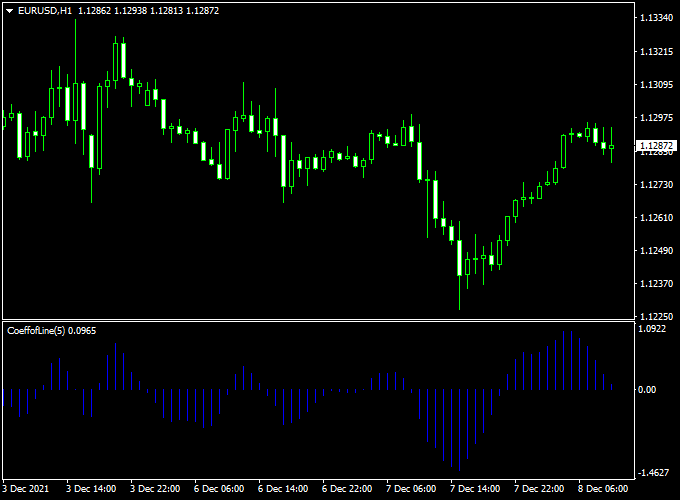
Indicator Example Chart (EUR/USD H1)
Below is a typical setup: candles on the main chart with the CoeffofLine Histogram in a subwindow.

How To Trade Using This Indicator
Core Idea
Trade in the direction of the histogram color and zero-line position. Use recent swing structure and ATR for risk management.
Optional: add a 50 EMA on price for trend bias.
Strategy Rules
Buy Setup
- Bias: Price above the 50 EMA (optional but recommended).
- Signal: Histogram turns above the zero line.
- Entry: Buy on the close of the signal candle or on a small pullback (e.g., 38.2–50% of the candle).
- Stop Loss: Below the recent swing low or 1.2 × ATR(14), whichever is further.
- Take Profit:
- Conservative: 1.5 × risk (R).
- Moderate: 2.0 × R.
- Trend-follow: Trail below higher lows or use ATR trailing stop (e.g., 1.5 × ATR).
Sell Setup
- Bias: Price below the 50 EMA (optional but recommended).
- Signal: Histogram turns below the zero line.
- Entry: Sell on the close of the signal candle or on a minor pullback.
- Stop Loss: Above the recent swing high or 1.2 × ATR(14), whichever is further.
- Take Profit:
- Conservative: 1.5 × R.
- Moderate: 2.0 × R.
- Trend-follow: Trail above lower highs or with ATR.
Trade Management Tips
- Reduce position size in choppy sessions (low ADR/ATR).
- Avoid counter-trend trades when the histogram color disagrees with the 50 EMA bias.
- When the histogram weakens (shrinking bars, fading toward zero), tighten stops or scale out.
- Best timeframes: M15–H4 for cleaner signals; M1–M5 for experienced scalpers only.
Download Now
Download the “CoeffofLine.mq4” indicator for Metatrader 4
Momentum Reversal MT4 Strategy: CoeffOfLine Histogram + Lucky Reversal Indicator
This strategy pairs the CoeffOfLine Histogram, a momentum/coefficient-based histogram that highlights strength and divergence, with the Lucky Reversal Indicator.
This reversal-confirmation tool marks high-probability tops and bottoms.
The combination aims to capture low-risk reversal entries aligned with short-to-medium-term momentum shifts.
Best used on M5–H1 depending on your trading style (scalping to intraday swing).
What is this strategy about?
The idea is simple: use the CoeffOfLine Histogram to measure momentum and look for momentum weakening or divergence, then wait for the Lucky Reversal signal to confirm the actual price reversal.
This reduces false reversal trades by requiring both a momentum condition and a pattern-based confirmation.
It works on majors and liquid crosses; avoid trading around major news releases unless you have a plan for that volatility.
Buy and Sell Rules
Buy Setup (Long)
- The CoeffOfLine Histogram shows a histogram above 0.
- The Lucky Reversal Indicator paints a bullish blue reversal signal.
- Entry: Place a buy at the close of the confirming candle.
- Stop loss: 8–20 pips below the recent swing low on lower timeframes (scale by timeframe/volatility) or below the channel/support line on higher timeframes.
- Take profit: target 1:1.8 to 1:3 R:R, or scale out at the next resistance zone; alternatively, trail stop under successive swing lows.
Sell Setup (Short)
- The CoeffOfLine Histogram shows a histogram below 0.
- The Lucky Reversal Indicator issues a bearish red reversal signal.
- Entry: short at the close of the confirming candle where the Lucky Reversal appears.
- Stop loss: 8–20 pips above the recent swing high on lower timeframes or above the resistance/channel line on higher timeframes.
- Take profit: 1:1.8 to 1:3 R:R, or use an exit at the next support; trailing stop behind lower highs.
Trader Case Studies
Below are three examples of traders who applied this strategy on different pairs and timeframes, showing how it can perform across styles and markets.
Mateo R – Mexico
Mateo, an intraday trader, tested the setup on EUR/USD and USD/JPY using M15 charts for two weeks. He focused on entries where the CoeffOfLine showed clear bearish momentum loss followed by a Lucky Reversal bullish arrow near session lows. Mateo used tight stops and partial scaling — his disciplined plan produced +185 pips net.
Ayodele O – Nigeria
Ayodele, a swing trader, deployed the strategy on H1 charts on GBP/USD and AUD/USD over a month. He waited for momentum exhaustion on the CoeffOfLine and used Lucky Reversal to enter reversals at channel edges. By sizing modestly and letting winners run with a trailing stop, Ayodele recorded +420 pips overall. He emphasized that on H1 the signals are fewer but much stronger.
Yasmin T – Turkey
Yasmin, a part-time scalper, tested the system on M5–M15 for three weeks on EUR/GBP and USD/CAD. She combined the indicators with session filtering (only London and NY overlaps). By taking smaller positions with a strict stop policy, Yasmin netted +135 pips. She found the Lucky Reversal arrows especially helpful to avoid chasing fades.
Disclaimer: Case studies are illustrative and educational. Actual trading results vary by trader, account size, risk management, and market conditions.
Advantages
- Two-layer confirmation — momentum plus pattern — reduces false signals.
- Flexible across timeframes: scalping (M5–M15) to swing (H1).
- Histogram divergence gives an early warning of momentum loss before a price reversal.
- Lucky Reversal gives clear visual entry points, speeding decision-making.
Drawbacks & Considerations
- In choppy, range-bound markets, the histogram can whipsaw; consider filtering with a volatility or choppiness indicator.
- Small-timeframe signals require tight execution and fast discipline (spread/ping matter).
- Risk management is essential; do not widen stops to “force” a trade to work.
- Backtest and forward-test on the demo before using live funds.
Strategy Conclusion & Practical Tips
This CoeffOfLine + Lucky Reversal strategy blends momentum analysis and reversal confirmation to generate higher-probability entries.
Start by demo-testing on the pairs and timeframe you prefer, use strict position sizing, and track performance in a simple journal (date, pair, TF, entry, SL, TP, outcome, notes).
Practical tips: (1) avoid trading through major economic releases, (2) prefer sessions with good liquidity (London/New York), (3) use spread-aware stop sizing on small timeframes, and (4) periodically re-optimize stop and take-profit sizing to current volatility.
Indicator Specifications
| Platform | MetaTrader 4 (MT4) |
|---|---|
| Indicator Type | Momentum / Trend Histogram |
| Recommended Pairs | Major FX pairs, Gold, and Indices (test first on your broker’s feed) |
| Timeframes | M15, M30, H1, H4 (scalpers may use M1–M5 with caution) |
| Buffers | Histogram values, zero line |
| Alerts | Optional (on color flip / zero cross if available) |
| Inputs |
|
FAQ
Does it repaint?
No. Values are calculated on closed candles. Signals may refine while the current candle is forming—wait for the candle close to confirm.
Which settings are best?
Start with Period 14 and Smoothing 1 on M15–H1. Increase the Period on higher timeframes for stability; decrease slightly on lower TFs for sensitivity.
Can I use it without any moving average?
Yes. The EMA filter is optional; it just helps align with the dominant trend to reduce false signals.
What markets does it work on?
Forex majors/minors, XAUUSD, and popular indices. Always forward-test on a demo to match your broker’s feed and spreads.
Final Words
The CoeffofLine Histogram is a clean, versatile momentum tool that simplifies decision-making.
Use the zero-line logic for entries, structure/ATR for risk, and an EMA bias to stay on the right side of the move.


