About the Convergent Divergent Indicator
The Convergent Divergent Indicator for Metatrader 4 is a professional-grade oscillator designed to detect shifts in market momentum and trend direction.
It operates as a sophisticated crossover system, utilizing a blue convergent/divergent line and a red signal line.
Because it uses a signal line crossover logic, it helps traders enter the market exactly when momentum begins to tilt in a new direction.
This makes it an ideal choice for participants who specialize in trend-following strategies or those looking to capture the initial stages of a trend change across any currency pair.
Free Download
Download the “convergent-divergent-range-volatility.mq4” MT4 indicator
Key Features
- The indicator features a dual-line crossover system for precise entry timing.
- A blue convergent/divergent line tracks short-term momentum shifts.
- A red signal line acts as a smoothed trigger for trend confirmation.
- The crossover logic provides immediate buy and sell signals on any timeframe.
- The tool adapts effectively to various volatility levels and asset classes.
Indicator Chart
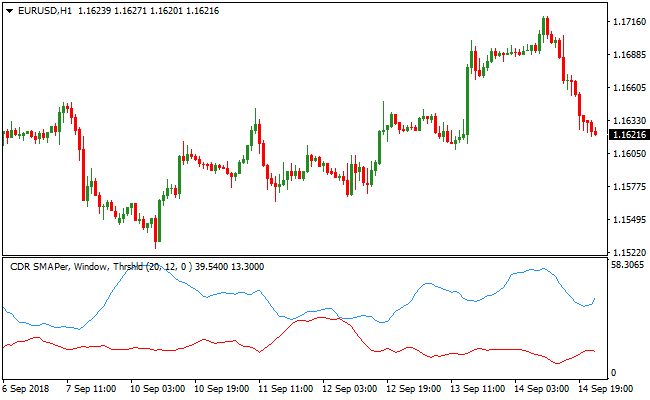
The chart displays the Convergent Divergent Indicator in the sub-window, featuring the blue and red signal lines.
You can see how these lines interact to generate signals; when the blue line crosses over the red line, it indicates a shift in momentum.

Guide to Trade with Convergent Divergent Indicator
Buy Rules
- Monitor the indicator window for the blue convergent/divergent line.
- Wait for the blue line to cross above the red signal line from below.
- Enter a buy position at the close of the candle where the crossover occurs.
- Prioritize signals that align with an established long-term bullish trend.
Sell Rules
- Monitor the indicator window for the blue convergent/divergent line.
- Wait for the blue line to cross below the red signal line from above.
- Initiate a sell position at the close of the candle where the crossover occurs.
- Prioritize signals that align with an established long-term bearish trend.
Stop Loss
- Place the stop loss a few pips below the most recent swing low for buy trades.
- Position the stop loss a few pips above the most recent swing high for sell trades.
- Use local support and resistance levels to define your risk parameters.
Take Profit
- Close the trade when an opposite crossover signal appears in the indicator window.
- Exit a buy trade when the blue line crosses back below the red signal line.
- Exit a sell trade when the blue line crosses back above the red signal line.
- Apply a fixed risk-to-reward ratio of at least 1:2 to ensure positive expectancy.
Convergent Divergent + SuperTrend MTF MT4 Forex Strategy
This forex strategy uses the Convergent Divergent MT4 Indicator and the SuperTrend MTF Forex Signal Indicator for MT4 to capture trend continuations backed by confirmed momentum shifts.
The Convergent Divergent indicator generates buy signals when its blue line crosses above the red line and sell signals when the blue line crosses below from above.
The SuperTrend MTF indicator confirms the direction of the prevailing trend: a green line indicates bullish conditions and a red line indicates bearish conditions.
This setup works well on M15 and H1 charts for day trading.
Combining a reliable momentum crossover with a trend confirmation filter helps reduce false entries and improves the chance of catching sustained price movement.
The strategy suits intermediate and experienced traders looking for a systematic approach that balances quick triggers with trend context.
It performs best on major currency pairs that demonstrate strong trending behavior during active sessions such as London and New York.
Buy Entry Rules
- The SuperTrend MTF line is green, indicating a bullish trend.
- The Convergent Divergent blue line crosses above the red line and closes above it, generating a buy signal.
- Enter a buy trade on the candle close after the crossover.
- Place stop loss below the recent swing low or a few pips behind the entry candle low.
- Take profit at a previous resistance level or allow the trade to run until the SuperTrend MTF line flips red.
Sell Entry Rules
- The SuperTrend MTF line is red, indicating a bearish trend.
- The Convergent Divergent blue line crosses below the red line and closes below it, generating a sell signal.
- Enter a sell trade on the candle close after the crossover.
- Place a stop loss above the recent swing high or a few pips above the entry candle high.
- Take profit at a previous support zone or allow the trade to run until the SuperTrend MTF line flips green.
Advantages
- Flexible profit exit options let trades capture full swing moves during strong trends.
- Clear crossover and trend rules make entries systematic and repeatable.
- Works well on major pairs with good intraday activity.
- Longer timeframes like H1 provide structure while still offering regular breakout opportunities.
Drawbacks
- Trades may be stopped out prematurely during choppy or ranging price action.
- Requires patience to wait for clear crossovers and trend alignment.
- Trend confirmations may lag slightly, causing entries after the initial move has begun.
Example Case Study 1
On EURUSD H1 during the London session, the SuperTrend MTF line was green, signaling a bullish trend.
The Convergent Divergent indicator showed the blue line cross above the red line at 1.1105.
The crossover candle closed above both lines and the price was clearly in an uptrend.
A buy trade was entered at 1.1107 with a stop loss set at 1.1085 just below the recent swing low.
Price continued higher for the next several hours, reaching resistance near 1.1160.
The trade was exited at 1.1158 for a profit of approximately 51 pips before the trend showed signs of weakening.
Example Case Study 2
On AUDJPY M15 during the New York session, the SuperTrend MTF line was red, confirming a bearish environment.
The Convergent Divergent blue line crossed below the red line at 87.42 and closed below it.
A sell trade was opened at 87.40 with a stop loss at 87.58 above the recent swing high.
Price continued downward and reached 87.10, capturing approximately 30 pips.
The trade was closed as the SuperTrend MTF line began to flatten, indicating a possible trend exhaustion.
Strategy Tips
- Focus on major currency pairs with strong intraday trends rather than exotic pairs with erratic moves.
- Confirm trend direction on a higher timeframe before scalping or trading breakouts on M15.
- Use a reliable execution broker to minimize slippage, especially when trading breakout moves.
- If price begins to consolidate after entry, consider moving your stop loss to breakeven to protect capital.
- Pair the strategy with support and resistance zones from a higher timeframe to filter low‑probability setups.
Download Now
Download the “convergent-divergent-range-volatility.mq4” Metatrader 4 indicator
FAQ
How does the crossover logic improve my trading?
The crossover between the blue and red signal lines acts as a momentum filter.
By waiting for the lines to cross, you ensure that the market has enough strength to move in your direction, which helps avoid entering trades during weak or flat price action.
Can I use this indicator for scalping?
Yes, the Convergent Divergent Indicator is very effective for scalping on lower timeframes like the M5 or M15.
Traders should look for crossovers during the high-liquidity London and New York sessions to ensure the best results and tighter spreads.
Should I use other indicators with this tool?
While the indicator is a complete crossover system, combining it with a trend-following tool like a 50-period EMA is highly beneficial.
This allows you to filter the signals and only take trades that move in the direction of the dominant market trend.
Summary
The Convergent Divergent Indicator is a versatile and reliable tool for any Metatrader 4 user.
Its primary strength lies in its clear crossover signals, which take the guesswork out of timing market entries.
By focusing on the interaction between the blue and red signal lines, traders can effectively navigate shifting market conditions and capture momentum early.


