About the Currency Pair Correlation Table Indicator
The Currency Pair Correlation Table Indicator for MT4 displays the relationship between different currency pairs in a clear, easy-to-read dashboard.
It calculates correlations over selected timeframes, helping traders understand which pairs move together and which move inversely.
This information can be critical for managing risk, avoiding duplicate positions, and improving trade timing.
Beginner-friendly and easy to use, the indicator opens in a separate chart window and updates in real time.
By visualizing correlations, traders can make more informed decisions, diversify positions, and identify potential hedging opportunities.
It is suitable for all currency pairs and timeframes.
Free Download
Download the “icorrelation-table-indicator.mq4” indicator for MT4
Key Features
- Displays correlations between multiple currency pairs in a single dashboard
- Shows positive, negative, and neutral correlations with percentage values
- Updates automatically in real time for dynamic analysis
- Helps traders avoid duplicate positions or overexposure
Indicator Chart
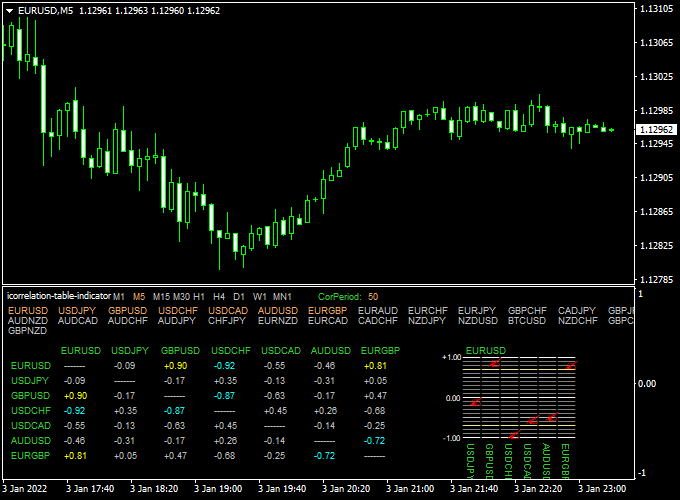
The chart below shows the Currency Pair Correlation Table Indicator in action.
The dashboard lists currency pairs along with correlation percentages, allowing traders to quickly identify which pairs move together or against each other.
This information can guide position sizing, hedging, and trade selection.

Guide to Trade with Currency Pair Correlation Table Indicator
Buy Rules
- Consider entering a buy trade if the pair shows low positive correlation with other pairs you are trading
- Ensure no conflicting positions are open on highly correlated pairs
- Use the correlation data to avoid simultaneous trades that amplify risk
Sell Rules
- Consider entering a sell trade if the pair shows low positive or negative correlation with other positions
- Avoid selling pairs that are highly positively correlated with open buy trades
- Use the correlation data to manage overall portfolio exposure
Stop Loss
- Set stop losses based on the pair’s individual support and resistance levels
- Adjust according to correlated pair movements to prevent simultaneous stops
Take Profit
- Target nearby support/resistance or key technical levels
- Consider correlated pairs’ positions when closing trades to avoid conflicts
Practical Tips
- Focus on highly correlated pairs to manage risk across multiple trades
- Use correlation insights to hedge positions or diversify trades
- Combine with trend or momentum indicators for better trade timing
- Check the dashboard regularly to account for changing correlations
- Use higher timeframe correlations for more stable, reliable signals
Currency Pair Correlation + 2 Moving Average Arrow MT4 Intraday Strategy
This intraday strategy combines the Currency Pair Correlation Table Indicator for MT4 with the 2 Moving Average Arrow Forex Indicator for MT4.
The strategy focuses on using correlation insights from multiple currency pairs along with precise entry signals from the moving average arrows to identify high-probability intraday trades.
The Currency Pair Correlation Table displays real-time correlation values between different pairs in a dashboard.
By observing which pairs move together or inversely, traders can filter trades and reduce risk exposure.
The 2 Moving Average Arrow indicator shows blue arrows for buy signals and magenta arrows for sell signals, providing clear visual cues for entries.
This strategy works best on M5 and M15 charts and is suitable for currency pairs such as EURUSD, GBPUSD, and AUDUSD.
It is ideal for traders who prefer quick entries, clear trend confirmation, and structured exits during intraday sessions.
Buy Entry Rules
- Identify pairs with a strong positive correlation and confirm they are moving in the same direction.
- Wait for a blue buy arrow from the 2 Moving Average Arrow indicator.
- Enter a buy trade at the open of the next candle after the arrow appears.
- Place a stop loss below the most recent swing low or nearest support level.
- Set take profit at 1.5 to 2 times the stop loss distance or exit if the arrow signal reverses.
Sell Entry Rules
- Identify pairs with a strong negative correlation or those aligned in a bearish direction.
- Wait for a magenta sell arrow from the 2 Moving Average Arrow indicator.
- Enter a sell trade at the open of the next candle after the arrow appears.
- Place a stop loss above the most recent swing high or nearest resistance level.
- Set take profit at 1.5 to 2 times the stop loss distance or exit if the arrow signal reverses.
Advantages
- Combines correlation analysis with precise entry signals for higher-probability trades.
- Helps manage risk by avoiding trades that conflict across correlated pairs.
- Easy-to-read arrow signals make trade execution fast and simple.
- Works well on short intraday timeframes like M5 and M15.
- Applicable across multiple currency pairs simultaneously.
Drawbacks
- Requires monitoring multiple pairs to fully utilize correlation insights.
- Less effective during low volatility or sideways markets.
- Arrow signals may lag slightly in extremely volatile conditions.
- Scalping requires quick reactions and attention.
- Stop loss and take profit placement are crucial for consistency.
Example Case Study 1
On the EURUSD M5 chart, the Currency Pair Correlation Table showed a strong positive correlation with GBPUSD.
A blue arrow appeared on the 2 Moving Average Arrow indicator, signaling a buy trade.
A position was entered at 1.1050 with a stop loss at 1.1042 and a take profit at 1.1065.
The trade captured 15 pips within 25 minutes, showing how correlation alignment with arrow signals can improve intraday scalping accuracy.
Example Case Study 2
On the AUDUSD M15 chart, the Currency Pair Correlation Table indicated a negative correlation with NZDUSD.
A magenta sell arrow appeared, confirming a short setup.
A sell trade was entered at 0.6738 with a stop loss at 0.6748 and a take profit at 0.6725.
The trade reached the target within 35 minutes, generating 13 pips.
This demonstrates the advantage of combining correlation insights with moving average arrow signals for intraday trades.
Strategy Tips
- Monitor the correlation dashboard before entering trades to avoid conflicting positions.
- Focus on pairs with clear correlation trends rather than weak or inconsistent correlations.
- Combine signals from both M5 and M15 charts to confirm momentum before entering a trade.
- Use smaller position sizes for highly correlated pairs to reduce overall risk.
- Track performance of each pair over the week to identify consistent setups.
- Trade only during active sessions and avoid low liquidity periods.
- Regularly review correlation patterns, as relationships between pairs can change over time.
Download Now
Download the “icorrelation-table-indicator.mq4” indicator for Metatrader 4
FAQ
How does the Currency Pair Correlation Table work?
It calculates correlations between multiple currency pairs and displays them in a dashboard, showing which pairs move together or inversely.
Can it improve trade risk management?
Yes. By monitoring correlations, traders can avoid overexposure and reduce the risk of duplicating positions on highly correlated pairs.
Does it provide entry or exit signals?
While it doesn’t provide direct buy/sell signals, it guides decision-making by highlighting correlations that affect risk and portfolio management.
Summary
The Currency Pair Correlation Table Indicator is a valuable tool for understanding how different currency pairs relate to each other.
Its dashboard shows correlation percentages, allowing traders to manage risk, avoid conflicting trades, and make more informed trading decisions.
It is beginner-friendly, works on all MT4 timeframes, and can be combined with trend or momentum indicators for enhanced strategy performance.
By incorporating correlation analysis into your trading routine, you can optimize position sizing, diversify exposure, and improve overall portfolio management.
This indicator simplifies the process of tracking multiple pairs and provides actionable insights for smarter trading.


