
About the Cycle Bar Forex Indicator
The Cycle Bar Forex Indicator for MT4 is designed to reveal repeating price cycles and market rhythm directly on your trading charts.
By showing the phases of bullish and bearish cycles with colored bars, it helps traders anticipate potential turning points in the market.
This tool is ideal for all types of traders—scalpers, day traders, and swing traders alike.
It works across any currency pair or timeframe, making it versatile for different trading styles and strategies.
Unlike some complex indicators, the Cycle Bar is simple and intuitive.
Free Download
Download the “cycle-bar.mq4” indicator for MT4
Key Features
- Displays cycle bars in green and red to mark bullish and bearish phases.
- Compatible with all timeframes and pairs.
- Helps detect trend shifts and potential reversals.
- Simple and easy to interpret.
- Can be combined with other indicators for confirmation.
Indicator Example Chart (EUR/USD H1)
The chart example below shows the Cycle Bar MT4 indicator applied in real market conditions.
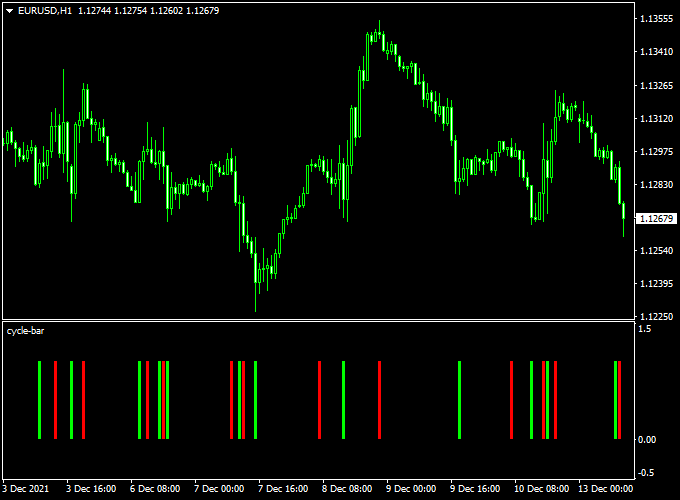
Example Chart & Explanation
The chart above shows the Cycle Bar MT4 indicator in action.
Green bars mark upward cycles, while red bars indicate downward cycles.
This visual makes it easier to spot potential entry points.
Traders can use the bars in combination with trend analysis or support and resistance levels.
It helps reduce guesswork and improves timing for both short-term and medium-term trades.
Trade Rules Using the Cycle Bar Indicator
Entry Rules
- Enter a long trade when a green cycle bar appears near a support level or after bullish confirmation from other indicators or price action.
- Enter a short trade when a red cycle bar appears near a resistance level or after bearish confirmation.
Stop Loss Rules
- For long trades, place a stop loss just below the most recent swing low.
- For short trades, place a stop loss just above the most recent swing high.
Take Profit Rules
- Set take profit at the next key support or resistance level.
- Alternatively, base take profit on the average length of recent cycles.
- Optional: Use a trailing stop based on ATR or price structure to capture extended trends.
Download Now
Download the “cycle-bar.mq4” indicator for Metatrader 4
Forex MT4 Strategy: Cycle Bar + Ichimoku Cloud Signals Indicator
What This Strategy Is About
This strategy combines the Cycle Bar Forex Indicator (MT4) with the Ichimoku Cloud Signals Indicator (MT4).
The Cycle Bar indicator works by analyzing the behavior of individual price bars to detect repeating market cycles.
It helps traders identify key turning points where the market may reverse or continue its current direction.
On the other hand, the Ichimoku Cloud Signals indicator offers a comprehensive overview of the market’s trend direction and momentum.
Together, these indicators help traders catch trend reversals and enter trades with strong confirmation.
Buy Rules
- The Cycle Bar indicator signals a green colored bar.
- The Ichimoku Cloud is colored blue, indicating an uptrend.
- Enter a long position at the close of the confirming candle.
- Place a stop loss below the recent swing low or below the Ichimoku cloud.
- Take profit can be set at prior resistance levels or by trailing stops.
Sell Rules
- The Cycle Bar indicator signals a red colored bar.
- The Ichimoku Cloud is colored magenta, indicating a downtrend.
- Enter a short position at the close of the confirming candle.
- Place a stop loss above the recent swing high or above the Ichimoku cloud.
- Take profit can be set at prior support levels or by trailing stops.
Trader Case Studies
Here are three examples of traders from different countries applying this strategy on various currency pairs and timeframes, showing positive results.
Fatima B – Morocco
Fatima, a swing trader from Casablanca, used this strategy on the USD/JPY 4-hour chart. By carefully following both indicator signals, she accumulated +260 pips over three weeks.
Javier M – Argentina
Javier, a day trader from Buenos Aires, applied this method on the EUR/USD and GBP/USD 1-hour chart. His disciplined approach resulted in a gain of +310 pips within a month.
Linh T – Vietnam
Linh, a scalper from Ho Chi Minh City, traded the EUR/USD pair on the 15-minute timeframe. Over ten trading days, she earned +140 pips using this combined strategy.
Disclaimer: These case studies are for educational purposes only. Actual trading results depend on market conditions, risk management, and trader discipline.
Advantages
- Provides multiple layers of confirmation for entries and exits.
- Works on various timeframes and currency pairs.
Drawbacks
- Less effective in sideways or highly volatile markets.
- Requires patience to wait for confirmation from both indicators.
Conclusion and Tips
By combining the Cycle Bar Indicator with the Ichimoku Cloud Signals, traders can gain a clearer picture of market cycles and trend direction.
This helps reduce false signals and improve trade timing.
For best results, trade during active market sessions and always use proper risk management.
Test the strategy on demo accounts to build confidence before live trading.
Indicator Specifications
| Platform: | MetaTrader 4 |
| Indicator Name: | Cycle Bar Forex Indicator |
| Timeframes: | All |
| Currency Pairs: | All |
| Inputs: | Cycle Length, Colors, Alerts |
| Download: | Free “cycle-bar.mq4” |
FAQ
Does this indicator repaint?
No, cycle bars stay fixed once formed.
Which timeframes work best?
It works on all timeframes, but H1 and H4 often provide the most reliable signals.
Can I combine it with other indicators?
Yes. It works well with EMA, RSI, or MACD for trend confirmation.
How can I avoid false signals?
Use higher timeframe trend confirmation and check support/resistance levels before entering a trade.
Is it beginner-friendly?
Yes. The visual cycle bars make it easy for traders of all levels to interpret market phases.
Final Words & Strategy Tips
The Cycle Bar Forex Indicator helps traders spot market cycles and improve timing.
It is most effective when combined with trend filters or other confirmation tools.
A simple strategy is to watch for cycle bar completions near key levels, then confirm the trend on a higher timeframe.
This approach increases the probability of success and helps capture cleaner entries.
Use it with proper risk management to maximize results.


