
About the Daily Support & Resistance Breakout indicator
The Daily Support & Resistance Breakout indicator for MT4 is designed for traders who focus on decisive price movements around key daily levels.
It automatically plots the most relevant daily support and resistance lines on the chart, allowing traders to concentrate on breakout behavior rather than manual level drawing.
The indicator uses two fixed reference levels for each trading day.
The red line marks daily resistance, while the blue line marks daily support.
These levels act as decision points where price often accelerates once broken.
When price closes beyond one of these levels, it signals potential continuation in the breakout direction.
The indicator fits intraday and short swing trading styles and integrates smoothly with price action confirmation techniques.
By focusing on daily levels, it helps filter weak moves and keeps attention on higher-quality breakout setups.
Free Download
Download the “daily-support-and-resistance-special.mq4” MT4 indicator
Key Features
- Automatically plots daily support and resistance levels.
- Uses fixed levels that remain stable throughout the trading day.
- Provides straightforward breakout-based trade signals.
- Works effectively with price action confirmation methods.
- Reduces chart clutter and manual analysis time.
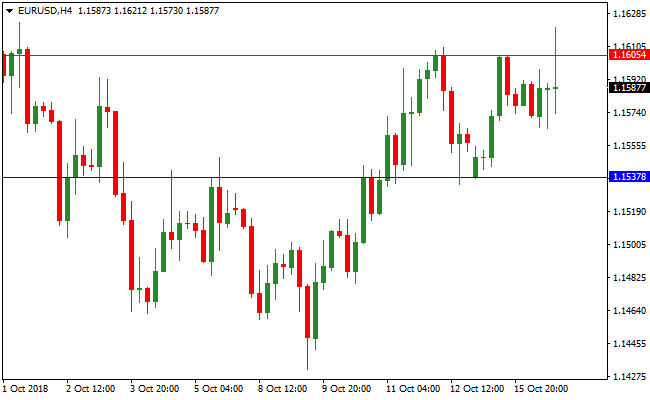
Indicator Chart
The chart example shows the Daily Support & Resistance Breakout indicator applied to a forex pair.
The red resistance line and blue support line define the daily breakout zones.
Buy and sell opportunities appear when price closes beyond these levels, signaling potential momentum expansion.
Guide to Trade with the Daily Support & Resistance Breakout indicator
Buy Rules
- Wait for the price to approach the daily resistance from below.
- Confirm that price crosses and closes above the resistance line.
- Open a buy trade after the breakout candle closes.
- Use price action confirmation if market conditions are slow.
Sell Rules
- Wait for the price to approach the daily support from above.
- Confirm that price crosses and closes below the support line.
- Open a sell trade after the breakout candle closes.
- Avoid entries during low-volatility sessions.
Stop Loss
- For buy trades, place the stop loss below daily resistance.
- For sell trades, place the stop loss above daily support.
- Allow enough room to avoid minor pullbacks.
Take Profit
- Close the entire buy trade if price closes back below resistance.
- Close the entire sell trade if price closes back above support.
- Alternatively, target the next significant daily level.
- Adjust targets based on average daily range.
Daily Support Resistance Breakout + Price Reversal Signal Strategy for MT4
This strategy combines the breakout detection of the Daily Support Resistance Breakout Indicator with the momentum confirmation of the Price Reversal Signal Indicator.
Buy trades are considered when price closes above a daily resistance and a green dot appears.
Sell trades are considered when price closes below a daily support and a red dot appears.
This method captures strong intraday movements while reducing false breakouts through momentum confirmation.
The strategy works best on M5 and M15 charts during active sessions when price reacts to daily levels.
Trades should only be taken when both breakout and reversal conditions are met, providing higher probability entries with defined risk management.
Buy Entry Rules
- Price closes above a daily resistance level.
- Price Reversal Signal indicator shows a green dot at or shortly after the breakout candle.
- Enter a buy trade at the close of the breakout candle or the next candle open.
- Place a stop loss a few pips below the breakout candle low or below the broken resistance.
- Take profit at the next swing high, or exit when a red dot appears.
Sell Entry Rules
- Price closes below a daily support level.
- Price Reversal Signal shows a red dot at or shortly after the breakout candle.
- Enter a sell trade at the close of the breakout candle or the next candle open.
- Place a stop loss a few pips above the breakout candle high or above the broken support.
- Take profit at the next swing low, or exit when a green dot appears.
Advantages
- Uses strong daily support and resistance levels, giving breakout moves more significance.
- Reversal signal confirmation filters false breakouts and improves timing of entries.
- Works on lower timeframes, allowing multiple trade opportunities per session.
- Stop loss and take profit levels are based on recent price structure for logical risk management.
Drawbacks
- Breakouts can fail, especially in low volatility or sideways markets.
- Waiting for both breakout and confirmation signals can limit the number of trades.
- Requires checking daily zones first, adding preparation time before trading lower timeframes.
- Profit targets may be small if price stalls after a breakout or if zones are wide.
Case Study 1 – Buy Trade on AUDUSD M5
During the London session, daily resistance at 0.6750 was broken when price closed at 0.6762.
The Price Reversal Signal displayed a green dot shortly after.
A buy trade was placed at 0.6762 with a stop loss at 0.6738.
Price moved up to 0.6790, and the trade was closed for a profit of 28 pips when the trend showed signs of slowing.
Case Study 2 – Sell Trade on USDCAD M15
On USDCAD, daily support at 1.3350 was broken when a 15-minute candle closed at 1.3340.
A red dot appeared on the Price Reversal Signal shortly after.
A sell trade was opened at 1.3340 with a stop loss at 1.3370.
Price dropped to 1.3308, and the trade was closed for a profit of 32 pips.
Strategy Tips
- Draw daily support and resistance zones before the market opens and update them after major daily candles close.
- Trade during high liquidity sessions such as London and New York for stronger breakout moves.
- Use reasonable position sizes and avoid overleveraging because false breakouts are possible.
- Exit trades early if an opposite signal appears to protect profits.
- Review past daily zone behavior because zones respected multiple times produce stronger breakouts when broken.
Download Now
Download the “daily-support-and-resistance-special.mq4” Metatrader 4 indicator
FAQ
What makes this indicator different from manual level drawing?
The indicator calculates and plots daily support and resistance automatically, saving time and removing subjective level placement.
Is this indicator suitable for breakout-only strategies?
Yes. It is built specifically for traders who focus on price closing beyond daily levels rather than fading reactions.
Should price action confirmation always be used?
Confirmation is optional, but it often improves trade quality, especially during ranging market conditions.
Can the indicator be used on all currency pairs?
It works across all major and minor pairs, though pairs with higher daily ranges tend to produce stronger breakouts.
Summary
The Daily Support & Resistance Breakout indicator offers a focused way to trade daily breakouts using predefined levels.
It removes guesswork and keeps attention on meaningful price movements.
The indicator performs strongly for traders who value simplicity and rule-based execution.
While adding confirmation tools can improve consistency, the core breakout logic already provides a solid foundation for daily level trading.


