
About the Indicator
The Daily Volume Forex Indicator for MT4 helps traders track the volume of trades occurring within a single day.
Volume analysis is a key component of understanding market strength and momentum, and this indicator displays daily volume data clearly on your charts.
By analyzing daily volume, traders can identify strong buying or selling pressure and improve their timing for entries and exits.
Key Features
- Displays daily trading volume directly on the MT4 chart
- Helps identify periods of high and low market activity
- Works on all forex pairs and timeframes
- Easy to configure and lightweight
- Supports volume-based trading strategies
How It Works
The indicator collects and aggregates tick volume data within each trading day and plots it on the chart.
Spikes in volume often precede or coincide with significant price movements.
Traders can watch for unusually high volume to confirm breakouts or reversals, or low volume to signal potential consolidation.
Free Download
Download the “aliev-fx-volumes.mq4” indicator for MT4
Benefits of Using the Indicator
- Improves market timing by highlighting strong volume days
- Helps confirm price breakouts and trend strength
- Useful for scalpers, day traders, and swing traders
- Complements other technical indicators and price action analysis
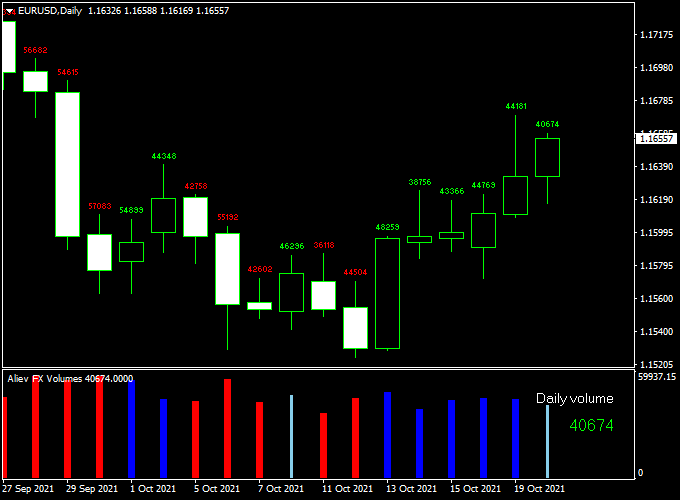
Indicator Example Chart (EUR/USD Daily)
How To Trade Using This Indicator
Entry Point
Look for significant increases in daily volume accompanying price breakouts or reversals. Enter long positions when volume spikes confirm bullish price action, and short positions when volume supports bearish moves.
Stop Loss
Use recent swing highs or lows to set stop losses, adjusting based on volatility and volume levels.
Take Profit
Target key support or resistance levels or use a fixed risk/reward ratio aligned with volume trends.
Daily Volume + 4 Time Frame Hull Trend Forex Strategy for MT4
This strategy combines the market participation insight of the Daily Volume Forex Indicator with the multi-timeframe trend confirmation of the 4 Time Frame Hull Trend Indicator.
By blending volume strength with trend alignment across multiple timeframes, this strategy provides a high-confidence framework for identifying strong continuation setups.
It works best on the M30 to H4 timeframes, particularly during high-liquidity sessions.
What Is This Strategy About?
The Daily Volume Indicator shows the current day’s volume and how it compares to previous days, helping traders understand whether a move is backed by real market participation.
The 4 Time Frame Hull Trend Indicator displays trend signals (typically green for bullish and red for bearish) based on the Hull Moving Average across four different timeframes.
By using volume confirmation with trend alignment, this strategy filters out weak or fake signals and highlights moves supported by both price and participation.
Buy Rules
Conditions:
- The 4 Time Frame Hull Trend Indicator shows a bullish signal (green trend) on at least 3 of the 4 timeframes.
- The Daily Volume Indicator shows volume above average or increasing relative to the previous day.
Entry:
Enter a buy trade when the Hull Trend confirms an uptrend across multiple timeframes and the Daily Volume indicates strong or growing participation.
Stop Loss:
Place a stop loss below the nearest swing low or a recent consolidation level.
Take Profit:
Use a fixed risk-reward ratio (e.g., 1:2 or 1:3), or close when Hull Trend starts turning bearish on two or more timeframes.
Sell Rules
Conditions:
- The 4 Time Frame Hull Trend Indicator displays bearish signals (red trend) on at least 3 of 4 timeframes.
- The Daily Volume is above average or rising compared to recent sessions, confirming conviction behind the move.
Entry:
Open a sell trade when the Hull Trend is aligned bearishly and volume confirms momentum behind the decline.
Stop Loss:
Set stop loss above the recent swing high or a resistance zone.
Take Profit:
Target the next support level or use a trailing stop based on Hull signal changes.
Advantages
- Filters out weak signals by requiring volume confirmation.
- Multi-timeframe trend alignment increases the probability of success.
- Clear visuals for both volume and trend make the system beginner-friendly.
- It can be applied to most currency pairs and timeframes.
Drawbacks
- Fewer trade setups due to strict volume and trend confirmation requirements.
- Volume data on MT4 is tick-based and not true exchange volume.
- May lag slightly in extremely volatile markets where quick reversals occur.
Conclusion
The Daily Volume + 4 Time Frame Hull Trend Strategy is a solid approach for traders looking to trade with the trend while ensuring that moves are backed by strong participation.
The Daily Volume Indicator adds a crucial layer of confirmation, while the 4 Time Frame Hull Trend Indicator ensures trend direction is consistent across multiple timeframes.
This combination helps traders avoid false signals and stay aligned with the market’s true momentum.
Download Now
Download the “aliev-fx-volumes.mq4” indicator for Metatrader 4
Indicator Specifications
| Indicator Name | Daily Volume Forex Indicator |
|---|---|
| Platform | MetaTrader 4 (MT4) |
| Timeframes | All timeframes |
| Pairs | All currency pairs |
| Inputs |
|
Examples, Use Cases, Pros and Cons
Example Use Case
Traders observe a volume spike on GBP/USD accompanied by a bullish breakout.
Confirming with the Daily Volume Indicator, they enter a long position, capturing a strong upward move.
✅ Pros
- Provides real-time insight into market activity
- Easy to interpret volume signals
- Complements price action and other indicators
❌ Cons
- Volume data on forex is based on tick volume, not actual traded contracts
- Requires additional confirmation to avoid false signals
Final Words
The Daily Volume Forex Indicator is a powerful tool to enhance your trading by showing when volume supports price moves.
Incorporate it into your strategy to improve trade timing and decision-making.


