About the indicator
The Damiani Volatmeter is a volatility and noise filter that helps traders identify when the market is trending or when it is too choppy to trade.
It displays two lines — a volatility strength line and a noise threshold — making it easy to see if the market conditions are favorable.
Many traders use it to filter breakouts, confirm trend signals, and avoid entries during low-quality conditions.
It works across forex pairs, commodities, and indices, and is especially useful for avoiding false breakouts.
Trade idea
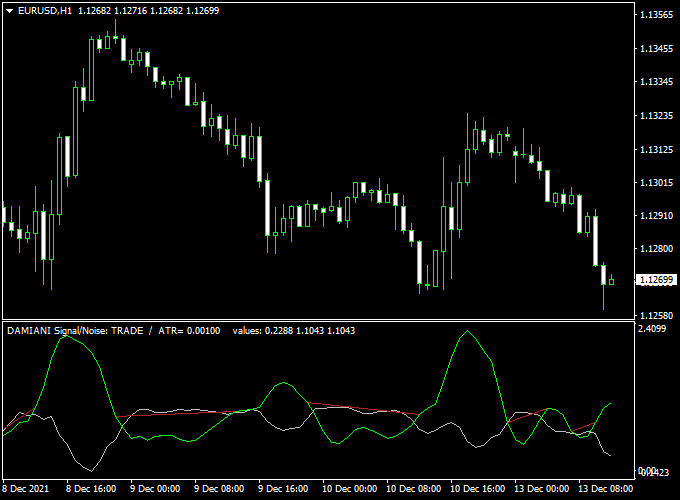
- Open a buy trade as soon as the green signal line crosses the gray signal line bottom-up.
- Open a sell trade as soon as the green signal line crosses the gray signal line top-down.
Free Download
Download the “Damiani_volatmeter.mq4” indicator for MT4
Key Features
- Measures volatility vs. noise with clear line visuals
- Shows when conditions are good for trend trades
- Customizable inputs for sensitivity and alerts
- Works on all timeframes (best on 15m, 1H, 4H)
- Email and sound alerts when volatility rises
- Lightweight and MT4 compatible
Indicator Example Chart (EUR/USD H1)
The chart below showcases the Damiani Volatmeter indicator in action on the trading chart.

How To Trade Using This Indicator
Entry rules
Trade only when the volatility line is above the noise threshold. Confirm direction using trend structure (higher highs for buys, lower lows for sells).
Buy Setup
Enter long when price breaks resistance or forms a bullish pullback while Volatmeter > threshold. Combine with a trend filter like EMA200 or RSI above 50 for stronger confirmation.
Sell Setup
Enter short when price breaks support or forms a bearish rally while Volatmeter > threshold. Confirm with EMA200 or RSI below 50 for higher accuracy.
Stop Loss
Place stop losses beyond recent swing highs/lows, or use 1–1.5x ATR. In higher volatility, allow slightly wider stops to avoid whipsaws.
Take Profit
Use key support/resistance zones or volatility-based targets (2–3x risk). A trailing stop with ATR or swing structure works well to capture longer moves.
Download Now
Download the “Damiani_volatmeter.mq4” indicator for Metatrader 4
Damiani Volatmeter & Moving Averages Trend Dashboard MT4 Strategy
This strategy combines the Damiani Volatmeter Forex Indicator with the Moving Averages Trend Dashboard Indicator.
The goal is to identify moments of high market volatility combined with a clear trend direction, improving the timing of trade entries and exits.
What Is This Strategy About?
The Damiani Volatmeter measures market volatility and indicates whether the market is trending or ranging.
When the Volatmeter shows a trending condition, it means volatility is sufficient to expect a strong price move.
The Moving Averages Trend Dashboard confirms the trend direction across multiple timeframes, providing a comprehensive view of market momentum.
By combining these two indicators, traders can avoid entering trades during low volatility or choppy markets and instead focus on high-probability trending conditions.
This synergy helps filter false signals and aligns entries with strong trends.
Buy and Sell Rules
Buy Setup
- Wait for the Damiani Volatmeter to indicate a trending market (green line above the gray line).
- Confirm that the Moving Averages Trend Dashboard shows a bullish trend across multiple timeframes.
- Enter a buy trade when both indicators align on an uptrend signal.
- Place your stop loss below the recent swing low or below a moving average level shown in the dashboard.
- Set your take profit based on your preferred risk/reward ratio or recent resistance levels.
Sell Setup
- Wait for the Damiani Volatmeter to signal a trending market (green line below the gray line).
- Confirm that the Moving Averages Trend Dashboard shows a bearish trend across multiple timeframes.
- Enter a sell trade once both indicators agree on a downtrend.
- Place your stop loss above the recent swing high or moving average resistance.
- Set your take profit according to your trading plan or recent support zones.
Trader Case Studies
Below are examples of traders who used this combined strategy across different currency pairs and timeframes, showing its flexibility and performance in real market conditions.
Isabella R – Spain
Isabella R, a swing trader from Spain, applied this strategy on the EUR/USD and USD/CAD pairs for 30 days. By focusing on trending volatility and clear trend direction, she made consistent profits totaling +278 pips.
Marcus T – South Africa
Marcus T, a full-time trader from South Africa, used this approach on the GBP/USD and USD/JPY pairs for 25 days. His disciplined trade management led to a total gain of +290 pips.
Linda W – Canada
Linda W, a day trader based in Canada, applied this strategy for two weeks, trading AUD/USD and NZD/USD. Despite the short timeframe, she achieved +140 pips by focusing only on strong trending signals.
Disclaimer: These case studies are for educational purposes only. Trading outcomes depend on market conditions, risk management, and personal discipline.
Advantages
- Combines volatility analysis with multi-timeframe trend confirmation for higher probability trades.
- Helps avoid trades during low volatility or ranging markets.
- Clear entry and exit points based on objective indicator signals.
- Works across multiple currency pairs and timeframes.
Drawbacks
- May miss some profitable trades in less volatile market conditions.
- Requires patience waiting for both indicators to align.
- Discipline is needed to stick to stop loss and take profit rules.
Strategy Conclusion and Tips
This strategy is ideal for traders who want to combine volatility and trend analysis to increase their trading edge.
The Damiani Volatmeter filters out low-volatility noise, while the Moving Averages Trend Dashboard ensures trades follow the dominant market direction.
Test the strategy on a demo account first to get familiar with the signals and timing.
Trade during sessions with good volatility, like London and New York, for the best results. Always use proper risk management and never trade without stop losses.
Indicator Specifications
| Platform | MetaTrader 4 |
| Type | Volatility / Noise Filter |
| Best Timeframes | 15m, 1H, 4H |
| Instruments | Forex pairs, indices, commodities |
| Signals | Volatility above threshold = trending; below = choppy |
| Inputs | VolPeriod (default 14) Smooth (default 7) NoiseThreshold (default 0.5) UseAlerts (true/false) AlertSensitivity |
| Download | Free MT4 indicator file |
FAQ
1. Which timeframe works best?
The 1H and 4H are best for clean signals, while 15m can be used for intraday trades with more noise filtering.
2. How to avoid false breakouts?
Combine Volatmeter signals with price structure and a trend filter like EMA200. Only trade when both confirm.
3. Can it be used for scalping?
Yes, but tighten stops and trade only during high-liquidity sessions like London and New York.
4. What indicators work well with it?
EMA200 for trend, RSI or MACD for momentum, and ATR for stop/target placement.
5. How to adjust risk when volatility changes?
Widen stops and lower lot size when volatility is high. Keep risk per trade consistent at 0.5–1% of account equity.
Final Words & Strategy Enhancement
The Damiani Volatmeter is excellent for filtering out bad trades during sideways markets.
Use it together with EMA200 and RSI to confirm direction and strength.
A solid approach is to trade only in the direction of EMA200, wait for breakouts or pullbacks, and confirm with Volatmeter above threshold.
Manage exits with ATR stops and partial profits.
This strategy reduces false trades and improves long-term consistency.


