
About the indicator
The Darvas Boxes indicator for MT4 plots dynamic price channels—’boxes’—around recent highs and lows, making it easier to spot breakout or trend continuation opportunities.
Ideal for traders who favor momentum-based signals, it automatically visualizes support and resistance zones.
This indicator works across all currency pairs and timeframes and is especially helpful during consolidations that precede strong directional moves.
Free Download
Download the “darvas-boxes.mq4” indicator for MT4
Key Features
- Automatically draws Darvas channels (boxes) on price action
- Non-repainting—boxes update after candle close
- Works on all currency pairs and timeframes
- Supports scalping, day trading, and swing setups
- Simple visual breakout signals via arrows for momentum entries
- Lightweight and easy to customize (colors & style)
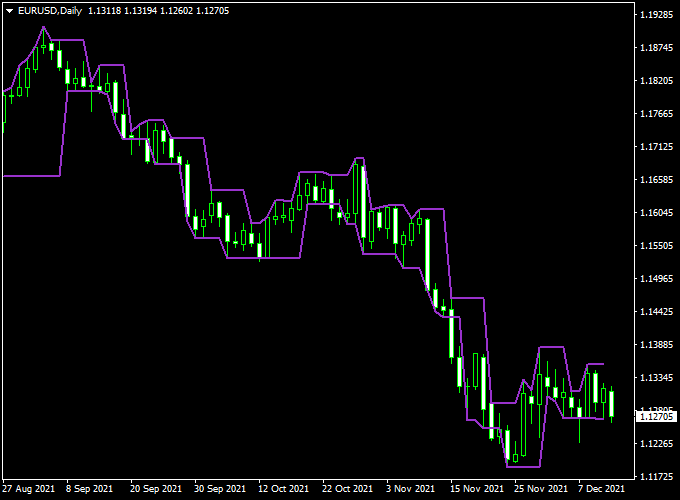
Indicator Example Chart (EUR/USD Daily)
The chart below shows the Darvas Boxes MT4 indicator applied directly to the price chart.
How To Trade Using This Indicator
Entry Strategy
Enter long when price closes above a Darvas box’s upper boundary—with confirmation from an arrow—and preferably when the broader trend is bullish (e.g., price above EMA200 or trendline).
Enter short when price closes below a box’s bottom boundary—with a bearish arrow—and the broader trend is bearish.
Stop Loss
For long trades, place your stop-loss just below the box low or a few pips beneath the breakout candle.
For short trades, place your stop just above the box high or breakout candle—this risk management echoes Darvas’s original methodology.
Take Profit / Exits
Use nearby structure, fixed R:R targets (e.g., 1:1, 2:1), or trail using subsequent Darvas boxes.
You can exit when a counter signal appears or momentum fades.
This aligns with the disciplined trade management Darvas advocated.
Download Now
Download the “darvas-boxes.mq4” indicator for Metatrader 4
Darvas Boxes & KG Wave Oscillator Forex Strategy
This strategy combines the Darvas Boxes Forex Indicator with the KG Wave Oscillator MetaTrader 4 Forex Indicator.
The goal is to identify breakout opportunities with momentum confirmation, enhancing the probability of successful trades.
What Is This Strategy About?
The Darvas Boxes indicator identifies breakout levels by drawing boxes around price consolidations.
When the price breaks above the upper box, it signals a potential buying opportunity; conversely, a break below the lower box suggests a potential selling opportunity.
The KG Wave Oscillator, a two-colored buy/sell trading signals oscillator, fluctuates above and below its zero level.
A bullish trend is indicated when the oscillator bars are aligned above the zero level, and a bearish trend is indicated when the bars are aligned below the zero level.
By combining these two indicators, traders can enter trades when both the price breaks out of a consolidation (as indicated by the Darvas Boxes) and the KG Wave Oscillator confirms the trend direction.
This approach aims to filter out false breakouts and align trades with the prevailing market momentum.
Buy and Sell Rules
Buy Setup
- Wait for the price to touch the upper boundary of the Darvas Box.
- Ensure the KG Wave Oscillator is above the zero line and the bars are colored blue, indicating a bullish trend.
- Enter a buy trade when both conditions are met.
- Place your stop loss below the recent swing low or below the lower boundary of the Darvas Box.
- Set your take profit based on your preferred risk/reward ratio or recent resistance levels.
Sell Setup
- Wait for the price to touch the lower boundary of the Darvas Box.
- Ensure the KG Wave Oscillator is below the zero line and the bars are colored red, indicating a bearish trend.
- Enter a sell trade when both conditions are met.
- Place your stop loss above the recent swing high or above the upper boundary of the Darvas Box.
- Set your take profit based on your preferred risk/reward ratio or recent support levels.
Trader Case Studies
Here are four examples of traders from different regions who successfully applied this breakout and trend confirmation strategy across various currency pairs and timeframes.
Jamal A – UAE
Jamal A, a part-time trader from the UAE, used this strategy on the USD/JPY and EUR/JPY pairs for 30 days. By patiently waiting for breakout confirmations with the KG Wave Oscillator, he earned a total of +377 pips.
Freya S – Sweden
Freya S, a swing trader from Sweden, applied this system on GBP/USD and EUR/GBP over four weeks. Her strict adherence to the entry and exit rules helped her secure +282 pips.
Kwame B – Ghana
Kwame B, a full-time trader in Ghana, focused on AUD/USD and NZD/USD pairs for 25 days. His disciplined approach and risk management led to gains of +389 pips.
Sophia L – Australia
Sophia L, a day trader based in Australia, tested the strategy on USD/CAD and EUR/USD for two weeks. She generated a solid profit of +156 pips by following the signals closely.
Disclaimer: These case studies are for educational purposes only. Trading results will vary based on market conditions, risk management, and individual discipline.
Advantages
- Combines breakout identification with trend confirmation to increase the probability of higher-quality trades.
- Helps avoid entering trades during low volatility or ranging markets.
- Clear entry and exit points based on objective indicator signals.
- Works across multiple currency pairs and timeframes.
Drawbacks
- May miss some profitable trades in less volatile market conditions.
- Requires patience waiting for both indicators to align.
- Discipline is necessary to adhere to stop-loss and take-profit rules.
Strategy Conclusion and Tips
This strategy is ideal for traders who want to combine breakout trading with trend confirmation to increase their trading edge.
The Darvas Boxes filter out low-volatility noise, while the KG Wave Oscillator ensures trades follow the dominant market direction.
Test the strategy on a demo account first to get familiar with the signals and timing.
Indicator Specifications
| Platform | MetaTrader 4 |
| Indicator Type | Channel / Breakout |
| Timeframes | Any (intraday to daily) |
| Instruments | All Forex pairs |
| Signals | Breakout above/below boxes → buy/sell arrows |
| Customization | Color, line style, alerts (if available) |
| Repainting? | No — confirms on candle close |
| Download | Free “darvas-boxes.mq4” file |
FAQ
1. What timeframe works best?
The indicator is adaptable: use daily or H4 for trend trades and M15–H1 for intraday setups. Confirm intraday breakouts with higher-timeframe trends for higher conviction.
2. How to avoid fake breakouts?
Wait for the candle to close beyond the box boundary (no repaint), and confirm with price structure (e.g., above EMA) or momentum tools like RSI >50 or MACD cross.
3. Is this suitable for scalping?
Yes — but limit trades to high-liquidity hours (e.g., London/New York overlap), tighten stops, and ensure clear breakout confirmation before entry.
4. Which tools pair well with Darvas Boxes?
Combine with trend filters like EMA, momentum indicators (RSI, MACD), volume, or range breakout tools—these enhance signal quality and filter false moves.
5. How to position-size around volatility?
Apply fixed risk as a percentage of account equity (e.g., 0.5–1%). Widen stops in more volatile scenarios and size accordingly to maintain consistent risk.
Final Words & Strategy Enhancement
Darvas’s method promotes simplicity, discipline, and momentum-based entries.
The MT4 indicator automates box drawing and allows for precise breakout signaling.
To boost effectiveness, integrate the Darvas Boxes into a broader strategy: trade in trend direction, use confluence from EMAs or momentum, wait for true breakout confirmations, and manage trades with ATR-based stops or multi-box trailing.
Log results, refine settings per pair and timeframe, and you’ll build a durable, high-probability trading approach.


