
About the Delta RSI Signals Indicator
The Delta RSI Signals indicator for MT4 is a momentum-based trading tool that converts RSI crossover logic into a practical colored histogram.
It is built on the interaction between a fast RSI with a 14-period setting and a slow RSI with a 50-period setting, combined with a signal level for confirmation.
Instead of reading raw RSI lines, the indicator displays the result as colored bars in a separate window.
A red histogram signals bullish market conditions and highlights potential buy opportunities.
A green histogram reflects bearish conditions and points to sell opportunities.
Gray bars appear when the market lacks direction and momentum weakens.
This tool can be traded on its own or paired with a trend-following indicator to improve filtering.
All key parameters can be adjusted in the input settings, allowing traders to fine-tune signal speed and sensitivity.
Free Download
Download the “delta-rsi-indicator.mq4” MT4 indicator
Key Features
- Histogram based on fast and slow RSI crossover logic.
- Red bars highlight bullish momentum conditions.
- Green bars highlight bearish momentum conditions.
- Gray bars identify flat or range-bound markets.
- Can be traded standalone or with trend confirmation.
- Fully adjustable RSI and signal level settings.
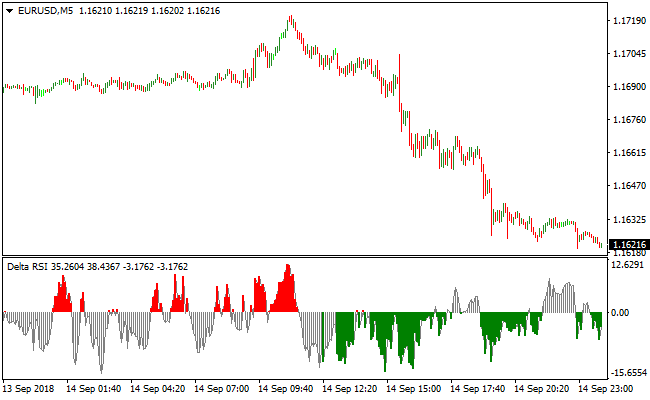
Indicator Chart
The image displays the Delta RSI Signals indicator as a colored histogram in a separate window.
Red and green bars highlight momentum direction based on RSI crossover behavior, while gray bars warn of sideways conditions.
These color changes help traders focus on active phases and avoid low-energy markets.
Guide to Trade with Delta RSI Signals
Buy Rules.
- Confirm the market shows bullish momentum or an upward price bias.
- Wait for the Delta RSI Signals histogram to turn red.
- Ensure the red bar follows a prior green or gray phase.
- Open a buy trade at the close of the confirming bar.
Sell Rules.
- Confirm bearish momentum or downward price pressure.
- Wait for the Delta RSI Signals histogram to turn green.
- Ensure the green bar follows a red or gray phase.
- Open a sell trade at the close of the signal bar.
Stop Loss.
- Place the stop loss beyond the most recent swing high or swing low.
- Allow enough room for normal price fluctuations.
- Adjust position size to keep risk consistent.
Take Profit.
- Close the entire position when the histogram prints an opposite color.
- Alternatively, exit near a major support or resistance level.
- Lock in profits if momentum weakens and gray bars appear.
Delta RSI + Simple EMA Crossover MT4 Scalping Strategy
This scalping strategy uses the Delta RSI Signals MT4 Indicator and the Simple EMA Crossover MT4 Indicator to catch short-term momentum and trend alignment on lower timeframes M1, M5, and M15.
The Delta RSI gives a momentum signal: when its histogram turns red and is above zero it signals bullish momentum, and when it turns green and is below zero it signals bearish momentum.
The Simple EMA Crossover shows trend direction using colored arrows: green for uptrend, red for downtrend.
Using both indicators together helps reduce noise and increase the probability of successful scalps.
Buy Entry Rules
- The Delta RSI histogram is red and above zero, indicating bullish momentum.
- Simple EMA Crossover shows a green arrow or price is above the EMA crossover zone, confirming an uptrend.
- Enter a buy trade at the close of the confirming candle.
- Place a stop loss a few pips below the recent swing low or entry candle low.
- Take profit at a small target of 5 to 15 pips or exit early if momentum fades or the trend arrow flips red.
Sell Entry Rules
- The Delta RSI histogram is green and below zero, indicating bearish momentum.
- Simple EMA Crossover shows a red arrow or price is below the EMA crossover zone, confirming a downtrend.
- Enter a sell trade at the close of the confirming candle.
- Place a stop loss a few pips above the recent swing high or entry candle high.
- Take profit at 5 to 15 pips or exit early if momentum weakens or the trend arrow flips green.
Advantages
- Combines momentum and trend confirmation for higher-probability trades.
- Works well on lower timeframes for fast scalping opportunities during active sessions.
- Clear entry and exit rules make the strategy easy to backtest and apply consistently.
Drawbacks
- Frequent trades increase exposure to spreads and slippage, which can reduce net gains.
- Momentum signals may fail in sideways or low-volatility markets.
- Requires constant attention, especially on M1 and M5 charts.
Example Case Study 1
On EURUSD M5 during the London session, the Delta RSI histogram turned red above zero at 1.2165 and the Simple EMA Crossover showed a green arrow confirming the trend.
A buy trade was entered at 1.2166 with a stop loss at 1.2159.
Price rose to 1.2181 within 10 minutes, and the trade was closed for a profit of 15 pips before momentum cooled.
Example Case Study 2
On AUDJPY M1 during a breakout, the Delta RSI histogram turned green below zero at 86.7,2 and the Simple EMA Crossover showed a red arrow confirming the downtrend.
A sell trade was entered at 86.71 with a stop loss at 86.80.
Price dropped to 86.59 within 5 minutes, yielding 12 pips profit before a bullish reversal appeared.
Strategy Tips
- Trade major currency pairs with tight spreads and high liquidity.
- Only enter trades when both the Delta RSI and EMA signals align to reduce false entries.
- Use small lot sizes and manage risk carefully due to the number of scalping trades.
- Keep a trading journal to track performance and refine the strategy over time.
Download Now
Download the “delta-rsi-indicator.mq4” Metatrader 4 indicator
FAQ
Why does the indicator use two RSI periods?
The fast RSI reacts quickly to price changes, while the slow RSI defines broader momentum. Their interaction helps identify stronger directional shifts.
What do gray histogram bars indicate?
Gray bars signal a lack of momentum. During these phases, price often consolidates or ranges, increasing the risk of false signals.
Can the Delta RSI Signals be used without other indicators?
Yes. It can function as a standalone momentum tool, though many traders add a trend filter for additional confirmation.
Are the default RSI settings mandatory?
No. Traders can modify the fast RSI, slow RSI, and signal level to suit different timeframes or trading styles.
Summary
The Delta RSI Signals Metatrader 4 forex indicator turns classic RSI crossover logic into a clean and actionable histogram.
Simplifying momentum shifts into clear color changes helps traders focus on timing rather than calculations.
Red bars point to bullish momentum, green bars highlight bearish pressure, and gray bars warn of non-trending conditions.
This combination supports both aggressive entries and patient trade filtering.
With adjustable settings, multi-timeframe compatibility, and optional trend confirmation, the Delta RSI Signals indicator fits a wide range of trading approaches.
It offers a balanced mix of simplicity and flexibility for traders seeking reliable RSI-based momentum signals.


