About the DIBS v1.0 Indicator
DIBS v1.0 is a free MetaTrader 4 Forex indicator that enables traders to trade breakouts above or below the daily open line.
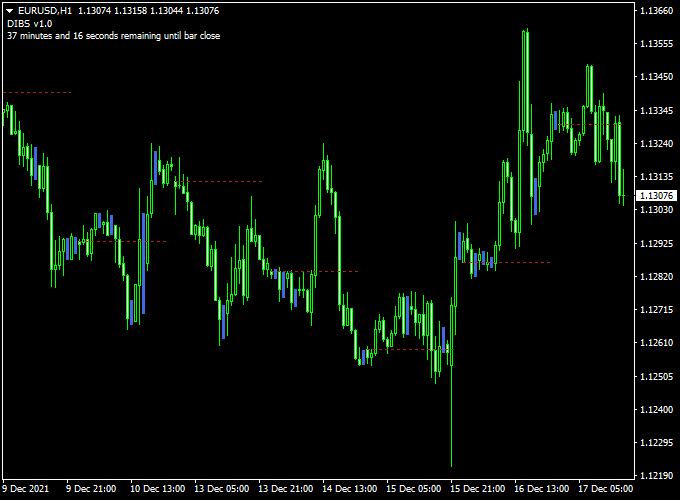
The indicator appears in the main MT4 chart window as a red daily open line, along with colored candlesticks.
The indicator also displays the time remaining until the next bar appears on the chart. This information is updated with every tick.
Trade idea
- Open a buy trade whenever the price closes above the daily open line and the overall trend is upwards.
- Open a sell trade whenever the price closes below the daily open line and the overall trend is downwards.
Free Download
Download the “dibs-indicator.mq4” indicator for MT4
Key Features
- Directional bias zones are shaded to see the trend direction quickly.
- Reversal or breakout arrows when price interacts with bias zones.
- Volatility-based filter to avoid signals during low volatility periods.
- Customizable inputs: sensitivity, timeframes, zone width, arrow display.
- Alert system: pop-ups, sound, email when conditions are met.
- Optimized for responsiveness while avoiding excessive noise.
Indicator Example Chart (EUR/USD H1)
The example chart below displays the DIBS v1.0 MT4 indicator in action on the trading chart.

The DIBS Supertrend MT4 Strategy
This strategy combines the DIBS V1.0 Indicator with the Supertrend MTF Forex Signal Indicator to create a powerful system for identifying high-probability trend trades.
The Supertrend MTF is a core trend-following tool that confirms the overall market direction, while the DIBS indicator acts as a precise signal generator to pinpoint your entry.
This dual-indicator approach helps to filter out false signals and ensures that trades are only taken in the direction of the dominant trend.
The strategy is effective on any currency pair and is best suited for time frames like M15 and above.
It is a solid system for both day traders and swing traders.
New and seasoned traders alike will find this strategy’s rules to be clear and straightforward.
Buy Entry Rules
- The Supertrend MTF indicator shows a bullish trend. This is typically indicated by a green line or color change on the chart.
- Price is above the DIBS indicator’s daily open line.
- Stop Loss: Place your stop loss just below the Supertrend MTF line or below the most recent swing low.
- Take Profit: Aim for a fixed target of 20-50 pips, or exit the trade when the Supertrend MTF line changes color, signaling a potential trend reversal.
Sell Entry Rules
- The Supertrend MTF indicator shows a bearish trend. This is typically indicated by a red line or color change on the chart.
- Price is below the DIBS indicator’s daily open line.
- Stop Loss: Place your stop loss just above the Supertrend MTF line or above the most recent swing high.
- Take Profit: Aim for a fixed target of 20-50 pips, or exit the trade when the Supertrend MTF line changes color, signaling a potential trend reversal.
Advantages
- Enhanced Confirmation: By combining the trend filter of the Supertrend MTF with the entry signals of the DIBS indicator, the strategy minimizes false signals and boosts trading accuracy.
- Clarity: Both indicators provide clear, easy-to-read signals, making the strategy simple to understand and execute for traders of all experience levels.
- Adaptable: The strategy can be used on various time frames and is effective on any currency pair, providing flexibility for different trading styles and schedules.
Drawbacks
- Choppy Market Performance: Like most trend-following systems, this strategy may struggle during periods of market consolidation or low volatility, leading to potential whipsaws and false signals.
- Signal Lag: Both indicators can sometimes lag behind the price, meaning you might enter a trade slightly late after a significant move has already occurred.
Case Studies
Case Study 1: Buy Trade
On a 30-minute chart for EUR/USD, the Supertrend MTF indicator’s line turned blue, confirming a new uptrend.
After a brief pullback, the price is above the DIBS indicator’s daily open line.
A buy trade was entered with the stop loss placed just below the Supertrend line.
The price rallied consistently, and the trade was successfully closed for a 40-pip profit.
Case Study 2: Sell Trade
On an H1 chart for EUR/JPY, the Supertrend MTF line turned red, signaling a downtrend.
A short time later, the price turned below the DIBS indicator’s daily open line.
A sell position was opened, with a stop loss placed above the Supertrend line.
The price dropped sharply over the next few hours, and the trader closed the trade for a 60-pip profit when the Supertrend line began to flatten.
This example demonstrates how the system can be used to ride a strong, confirmed trend.
Strategy Tips
- Start with Higher Time Frames: Begin by using this strategy on H1 or H4 charts to get a feel for it. Higher time frames typically provide smoother trends and fewer false signals.
- Risk Management: Always set a stop loss and never risk more than 1-2% of your trading capital on any single trade.
- Patience: Do not force a trade. Wait for a perfect confluence of signals from both indicators before entering the market. This patience will be rewarded with higher-quality setups.
Download Now
Download the “dibs-indicator.mq4” indicator for Metatrader 4
Indicator Specifications
| Specification | Details |
|---|---|
| Name | DIBS v1.0 Forex Indicator |
| Platform | MetaTrader 4 (MT4) |
| Type | Directional Bias Zones + Volatility Filter + Arrows |
| Timeframes | All timeframes supported (recommendation: H1–H4 for swing, M5–M15 for scalping) |
| Instruments | Forex pairs, indices, commodities, crypto |
| Outputs | Shaded bias zones, arrows, alerts |
| Inputs |
|
| Included | Indicator file (.ex4), setup guide & strategy instructions |
FAQ — Practical & Strategy-Focused
1. Is DIBS v1.0 suitable for both trending and ranging markets?
DIBS works best in trending markets when price respects bias zones.
In ranging markets, reduce sensitivity and only take signals near zone boundaries with confirmation (e.g., momentum or volume).
Avoid using DIBS in very flat or low volatility sessions.
2. Can this indicator be used alone?
It’s possible, but the risk is higher. Better results come when combining DIBS with trend filters (EMA 200 or Median Line on higher TF), and momentum/oscillator tools (RSI, Stochastic) to confirm signal context.
Always check the higher timeframe bias before entering.
3. How do I adjust for different pairs or volatility levels?
On high volatility instruments (like GBP/JPY, exotic pairs), increase the VolatilityThreshold and widen zone boundaries.
On quieter pairs, lower sensitivity and reduced zone width. Backtest settings per pair to find the optimal balance.
4. What timeframes yield the best risk-reward setups?
H1 tends to offer a balance — enough movement yet not too much noise.
Use M5–M15 for quick trades with tighter stops, but accept a lower win rate.
For swing setups, use H4 or daily chart entries after confirmation from H1 or H2/3.
5. How should I size positions and manage risk with DIBS?
Risk no more than 1-2% of your account per trade. Use volatility (ATR) to size your stop.
Partial profit taking at 1:1, full at 2:1 or more.
Trail stop when reversal becomes strong and price moves favorably through the bias zone and beyond.
Summary
DIBS v1.0 is a powerful tool when used correctly with other filters.
For best results: identify the trend on a higher timeframe, wait for the price to enter a bias zone, and confirm with volatility and momentum.
This approach gives clarity, defined risk, and a consistent strategy for both intraday and swing traders.


