About the DM Oscillator Indicator
The DM Oscillator for MT4 is a momentum and divergence tool designed to reveal shifts in buying and selling pressure before they fully appear on price.
By combining smoothed momentum readings with divergence detection, the indicator helps traders spot early reversals, confirm trend strength, and avoid common false signals.
It’s suitable for intraday scalpers and longer-term swing traders who want an objective momentum filter and clearer entry signals.
Finding buy and sell trade opportunities is easy with this indicator:
- Open a buy trade as soon as the colored dot crosses the 0.00 level bottom-up and the overall trend is upwards.
- Open a sell trade as soon as the colored dot crosses the 0.00 level top-down and the overall trend is downwards.
The indicator works equally well on all assets (Forex, CFD stocks, Indices, Cryptocurrencies, Commodities, etc.) and shows promising results if used correctly.
Free Download
Download the “dm-oscillator.mq4” indicator for MT4
Key Features
- Momentum oscillator with smoothing to reduce noise.
- Cross-over signals between the DM line and the signal line for entries/exits.
- Adjustable sensitivity, smoothing, and lookback parameters.
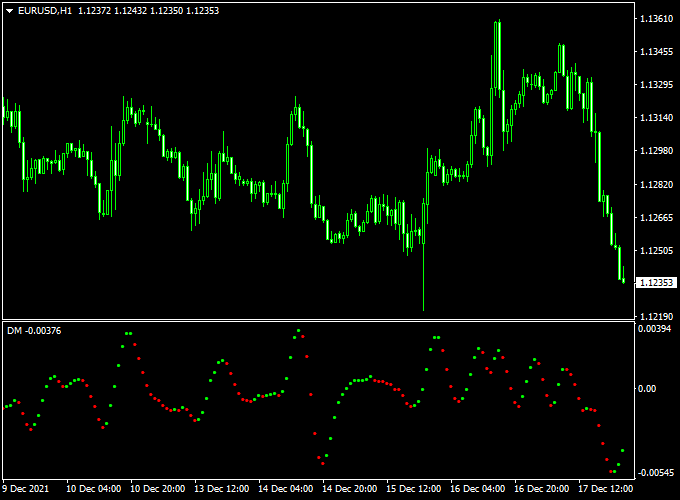
Indicator Example Chart (EUR/USD H1)
This sample chart highlights the DM Oscillator MT4 indicator detecting momentum shifts in real time.

The DM Oscillator William R Histogram MT4 Strategy
This strategy combines the DM Oscillator Indicator with the William R Histogram Indicator to create a dynamic and highly filtered trading system.
The DM Oscillator is a fast-acting momentum tool that provides clear buy and sell signals.
The William R Histogram acts as a trend filter, ensuring that each signal is backed by strong momentum and helping to filter out false or weak signals.
By using this dual-indicator approach, you can improve the quality of your entries and reduce the risk of whipsaws, especially in a choppy market.
This system is suitable for any currency pair and is particularly effective on time frames from M1 to H1.
Buy Entry Rules
- The DM Oscillator indicator turns above the zero level, signaling a new bullish momentum.
- The William R Histogram indicator displays green bars, confirming the bullish momentum.
- Stop Loss: Place your stop loss below the most recent swing low.
- Take Profit: Exit when the DM Oscillator turns below the zero level, or when the William R Histogram changes to a red color.
Sell Entry Rules
- The DM Oscillator indicator turns below the zero level, signaling a new bearish momentum.
- The William R Histogram indicator displays red bars, confirming the bearish momentum.
- Stop Loss: Place your stop loss above the most recent swing high.
- Take Profit: Exit when the DM Oscillator turns above the zero level, or when the William R Histogram changes to a green color.
Advantages
- High-Quality Signals: The dual confirmation from two different momentum tools significantly increases the probability of a successful trade.
- Clarity: Both indicators are visually straightforward to read, making the system simple to understand and execute for traders of all experience levels.
- Versatility: The system can be used on a wide range of currency pairs and time frames, offering flexibility to suit different trading preferences.
Case Studies
Case Study 1: Buy Trade
On an M30 chart for NZD/USD, the DM Oscillator turned above 0, signaling a new bullish push.
Concurrently, the William R Histogram showed a green bar, confirming the momentum.
A buy trade was entered with a stop loss placed below the recent swing low.
The price continued to climb, and the trade was successfully closed for a solid profit when the DM Oscillator turned below 0, signaling a potential reversal.
Case Study 2: Sell Trade
On an M5 chart for GBP/USD, the DM Oscillator turned below 0, signaling a new bearish push.
The William R Histogram also showed a red bar, confirming the momentum.
A sell trade was opened with a stop loss placed above the recent swing high.
The price dropped over the next few hours, and the trade was exited for a significant profit when the William R Histogram changed to a green color, indicating a loss of bearish momentum.
Strategy Tips
- Confirm the Momentum: Always ensure both indicators are in full agreement before taking a trade. Never enter a trade if one indicator is green and the other is below the zero level.
- Test on a Demo Account: Before risking real money, backtest and forward-test this strategy on a demo account to get a feel for how it works on your chosen currency pairs and time frames.
- Trade with Discipline: Stick to the rules. Do not enter a trade if both indicators are not in clear agreement.
Download Now
Download the “dm-oscillator.mq4” indicator for Metatrader 4
Indicator Specifications
| Specification | Details |
|---|---|
| Platform | MetaTrader 4 (MT4) |
| Timeframes | All (recommended H1, H4, Daily) |
| Inputs |
|
| File | DM_Oscillator.ex4 |
| License | Free download — personal use only |
FAQ
1. Will the oscillator repaint?
No — signals are fixed on bar close.
The indicator may recalculate while a bar is open (like most oscillators), so always use the closed bar as confirmation to avoid repaint issues.
2. Can I scalp with the DM Oscillator on M5/M15?
You can, but expect more noise.
Use higher timeframe confirmation (H1) or a trend filter to avoid false signals, and tighten stops when scalping lower timeframes.
3. How do I handle signals during major news events?
News can produce false crossovers and sudden divergence shifts.
Consider disabling auto-entry, widening stops, or avoiding new trades in the 15–30 minutes around high-impact releases.
Summary
The DM Oscillator is a practical momentum + divergence tool that improves timing for both trend-following and reversal trades.
A reliable strategy: on H4, take bullish DM signals only when the price is above EMA200 and a bullish divergence forms.
Enter on confirmation candle close, set SL below the divergence swing, and target the next structure with at least a 1:2 R:R.
Combining the DM Oscillator with simple trend and momentum filters reduces noise and increases your win probability across timeframes.


