About the Doji Pattern Detector Indicator
Doji Pattern Detector is a free price action indicator for MT4 (Metatrader 4) that finds and displays Doji candlestick patterns on the activity chart.
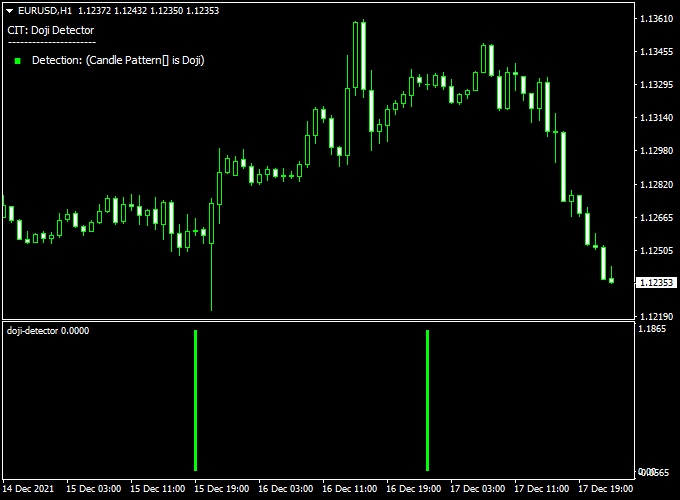
The Doji indicator appears in a separate MT4 chart window as green colored bars and can be used to find high-probability trade entries and exits.
Each green colored bar represents the Doji Pattern.
For scalping purposes, the indicator tends to work the best during the London and American trading sessions.
Key Features
- Real-Time Detection: Instantly identifies Doji candlestick patterns as they form on your chart.
- Customizable Alerts: Set up on-screen, email, or push notifications to stay informed of pattern formations.
- Multiple Timeframe Support: Analyze Doji patterns across various timeframes to suit your trading strategy.
- Easy Installation: Simple setup process compatible with MT4 platforms.
Free Download
Download the “doji-detector.mq4” indicator for MT4
Indicator Chart (EUR/USD H1)
Below is an example of how the Doji Pattern Detector Indicator displays on an MT4 chart.

Buy and Sell Trading Rules
Buy Signal
- Entry: Enter a buy position when a Doji pattern appears after a downtrend, indicating potential bullish reversal.
- Stop Loss: Place a stop loss just below the low of the Doji candle to manage risk.
- Take Profit: Set a take profit level at a recent resistance zone or use a risk-reward ratio of at least 2:1.
Sell Signal
- Entry: Enter a sell position when a Doji pattern appears after an uptrend, suggesting a possible bearish reversal.
- Stop Loss: Place a stop loss just above the high of the Doji candle.
- Take Profit: Set a take profit level at a recent support zone or use a risk-reward ratio of at least 2:1.
Doji + BOS-CHOCH MT4 Strategy: A Smart Money Approach
This strategy combines two powerful MT4 indicators: the Doji Pattern Detector and the BOS-CHOCH Market Structure Indicator.
It is designed for traders who follow Smart Money Concepts (SMC) and Inner Circle Trader (ICT) methodologies.
By integrating candlestick pattern recognition with market structure analysis, this approach aims to identify high-probability entry points in trending markets.
Buy Entry Rules
- Signal Confirmation: Wait for a Doji candle to appear, indicating market indecision.
- Market Structure: Ensure the BOS-CHOCH indicator shows a Break of Structure (BOS) in an uptrend, confirming trend continuation.
- Entry Point: Enter a buy trade at the close of the Doji candle.
- Stop Loss: Place the stop loss below the low of the Doji candle.
- Take Profit: Set the take profit at a recent swing high or a predetermined risk-to-reward ratio.
Sell Entry Rules
- Signal Confirmation: Wait for a Doji candle to appear, indicating market indecision.
- Market Structure: Ensure the BOS-CHOCH indicator shows a Break of Structure (BOS) in a downtrend, confirming trend continuation.
- Entry Point: Enter a sell trade at the close of the Doji candle.
- Stop Loss: Place the stop loss above the high of the Doji candle.
- Take Profit: Set the take profit at a recent swing low or a predetermined risk-to-reward ratio.
Advantages
- Clear Entry Signals: Combines candlestick patterns with market structure for precise entries.
- Trend Confirmation: Ensures trades align with the prevailing market trend.
- Adaptability: Suitable for various timeframes and currency pairs.
Drawbacks
- Requires Patience: Signals may not appear frequently, requiring traders to wait for optimal setups.
- False Signals: In choppy or sideways markets, Doji candles may produce false signals.
- Indicator Dependency: Relies heavily on the accuracy of the indicators used.
Example Case Studies
Case Study 1: EUR/USD (1-Hour Chart)
On the EUR/USD 1-hour chart, a Doji candle formed after a series of higher highs and higher lows.
The BOS-CHOCH indicator confirmed a Break of Structure in the uptrend.
A buy trade was executed at the close of the Doji candle, with the stop loss placed below the Doji low and the take profit set at the next swing high.
The trade resulted in a 3:1 risk-to-reward ratio.
Case Study 2: GBP/JPY (4-Hour Chart)
On the GBP/JPY 4-hour chart, a Doji candle appeared during a downtrend.
The BOS-CHOCH indicator confirmed a Break of Structure in the downtrend.
A sell trade was entered at the close of the Doji candle, with the stop loss above the Doji high and the take profit set at the next swing low.
The trade achieved a 2.5:1 risk-to-reward ratio.
Strategy Tips
- Use Multiple Timeframes: Analyze higher timeframes for trend direction and lower timeframes for precise entry points.
- Risk Management: Always use proper risk management techniques, such as limiting risk to 1-2% of your trading capital per trade.
Download Now
Download the “doji-detector.mq4” indicator for Metatrader 4
Indicator Specifications
| Specification | Details |
|---|---|
| Platform Compatibility | MetaTrader 4 (MT4) |
| Pattern Detected | Doji Candlestick |
| Alert Types | On-Screen, Email, Push Notifications |
| Timeframe Support | All Timeframes |
| Installation | Easy Installation via MT4 Platform |
FAQ
1. What is a Doji candlestick pattern?
A Doji candlestick pattern occurs when the opening and closing prices are nearly equal, forming a cross-like shape.
It signifies market indecision and potential reversal points.
2. Can I use this indicator on any currency pair?
Yes, the Doji Pattern Detector Indicator can be applied to any currency pair available on your MT4 platform.
3. Is this indicator suitable for all trading strategies?
While the indicator is versatile, it works best when combined with other technical analysis tools and indicators to confirm trade signals.
Summary
The Doji Pattern Detector Indicator for MT4 is an invaluable tool for traders seeking to identify market indecision and potential reversal points.
Its real-time detection, customizable alerts, and ease of use make it a must-have for both novice and experienced traders.
By incorporating this indicator into your trading strategy, you can enhance your decision-making process and improve your trading outcomes.


