
About the Dorsey Inertia Forex Indicator
The Dorsey Inertia Forex Indicator for MT4 is a momentum oscillator developed by Donald Dorsey, designed to identify the strength and direction of long-term market trends.
Building upon the Relative Volatility Index (RVI), this indicator incorporates a smoothing function to provide a clearer picture of market inertia.
It operates on a scale from 0 to 100, with the midpoint at 50 serving as a threshold between bullish and bearish trends.
When the indicator crosses above 50, it suggests increasing bullish momentum; conversely, crossing below 50 indicates growing bearish momentum.
Traders can use this indicator to confirm trend directions and identify potential entry and exit points, enhancing their trading strategies.
Key Features
- Trend Strength Measurement: Assesses the strength of long-term market trends.
- Smoothing Function: Incorporates a smoothing function for clearer trend identification.
- Scale from 0 to 100: Provides a quantitative measure of market momentum.
- Midpoint at 50: Serves as a threshold between bullish and bearish trends.
- Customizable Settings: Allows adjustment of parameters to suit individual trading strategies.
- Free Download: Available for free to enhance your trading toolkit.
Free Download
Download the “dorsey-inertia.mq4” indicator for MT4
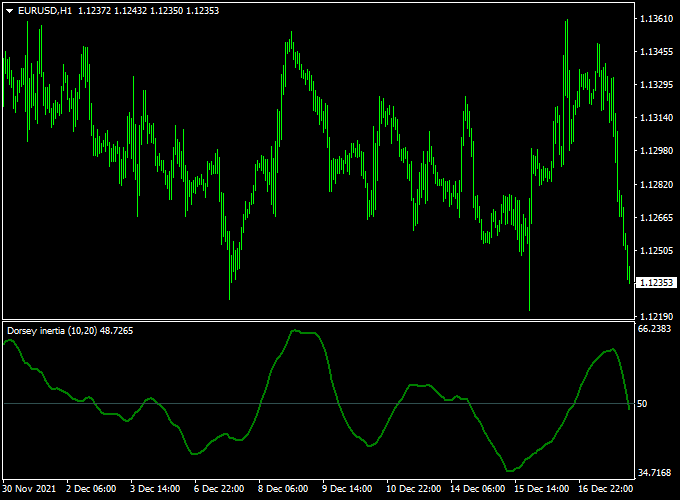
Indicator Chart (EUR/USD H1)
Below is an example of how the Dorsey Inertia Forex Indicator appears on an MT4 chart
Buy and Sell Trading Rules
Buy Signal
- Entry: Enter a buy position when the Dorsey Inertia Indicator crosses above the 50 level, indicating increasing bullish momentum.
- Stop Loss: Place a stop loss below the recent swing low to manage risk.
- Take Profit: Set a take profit level based on a favorable risk-reward ratio or at a significant resistance level.
Sell Signal
- Entry: Enter a sell position when the Dorsey Inertia Indicator crosses below the 50 level, signaling growing bearish momentum.
- Stop Loss: Position a stop loss above the recent swing high to protect against adverse price movements.
- Take Profit: Determine a take profit level using a favorable risk-reward ratio or at a notable support level.
Dorsey Inertia + Pips Hunter MT4 Strategy: Trend Momentum with Entry Precision
This strategy combines the Dorsey Inertia Indicator and the Pips Hunter Indicator for MT4.
It is designed for traders who seek to capitalize on strong market trends with precise entry points.
By using the Dorsey Inertia Indicator to identify the strength and direction of the trend and the Pips Hunter Indicator to pinpoint optimal entry moments, this approach aims to enhance trading accuracy and profitability.
Buy Entry Rules
- Trend Confirmation: Wait for the Dorsey Inertia Indicator to cross above the 50 level, indicating a strong upward trend.
- Entry Signal: Enter a buy trade when the Pips Hunter Indicator displays a blue arrow, signaling a potential upward move.
- Stop Loss: Place the stop loss below the most recent swing low or a predefined percentage of the entry price.
- Take Profit: Set the take profit at a recent swing high or use a risk-to-reward ratio that aligns with your trading plan.
Sell Entry Rules
- Trend Confirmation: Wait for the Dorsey Inertia Indicator to cross below the 50 level, indicating a strong downward trend.
- Entry Signal: Enter a sell trade when the Pips Hunter Indicator displays a red arrow, signaling a potential downward move.
- Stop Loss: Place the stop loss above the most recent swing high or a predefined percentage of the entry price.
- Take Profit: Set the take profit at a recent swing low or use a risk-to-reward ratio that aligns with your trading plan.
Advantages
- Clear Trend Identification: The Dorsey Inertia Indicator provides a clear indication of the market’s trend strength and direction.
- Precise Entry Points: The Pips Hunter Indicator offers timely entry signals, enhancing trade accuracy.
- Adaptability: This strategy can be applied to various timeframes and currency pairs, offering flexibility to traders.
Drawbacks
- Lagging Nature: Both indicators rely on past price data, which can delay signals during rapid market movements.
- Indicator Overlap: Using two indicators may sometimes give conflicting signals, requiring careful interpretation.
- Limited Scalping Use: This strategy is better suited for swing or trend trading and may not perform well on very short timeframes.
Example Case Studies
Case Study 1: EUR/USD (1-Hour Chart)
On the EUR/USD 1-hour chart, the Dorsey Inertia Indicator crossed above the 50 level, indicating a strong upward trend.
The Pips Hunter Indicator then displayed a blue arrow, signaling a potential upward move.
A buy trade was executed at the close of the candle, with the stop loss placed below the most recent swing low and the take profit set at a recent swing high.
The trade resulted in a 3:1 risk-to-reward ratio.
Case Study 2: USD/JPY (30-minute Chart)
On the USD/JPY 30-minute chart, the Dorsey Inertia Indicator crossed below the 50 level, indicating a strong downward trend.
The Pips Hunter Indicator then displayed a red arrow, signaling a potential downward move.
A sell trade was entered at the close of the candle, with the stop loss above the most recent swing high and the take profit set at a recent swing low.
The trade achieved a 2.5:1 risk-to-reward ratio.
Strategy Tips
- Use Multiple Timeframes: Analyze higher timeframes for trend direction and lower timeframes for precise entry points.
- Trade During High Liquidity Sessions: Focus on trading during the London and New York sessions when market liquidity is higher, reducing the likelihood of false signals.
- Practice on a Demo Account: Before applying this strategy to a live account, practice on a demo account to gain confidence and refine your trading skills.
Download Now
Download the “dorsey-inertia.mq4” indicator for Metatrader 4
Indicator Specifications
| Specification | Details |
|---|---|
| Platform Compatibility | MetaTrader 4 (MT4) |
| Indicator Type | Momentum Oscillator |
| Calculation Basis | Relative Volatility Index with Smoothing Function |
| Scale | 0 to 100 |
| Midpoint | 50 (Threshold between Bullish and Bearish Trends) |
| Customizable Parameters | Yes |
| Free Download | Yes |
FAQ
1. What is the Dorsey Inertia Forex Indicator?
The Dorsey Inertia Forex Indicator is a momentum oscillator that measures the strength and direction of long-term market trends, helping traders identify potential entry and exit points.
2. Can I use this indicator on any currency pair or timeframe?
Yes, the Dorsey Inertia Indicator can be applied to any currency pair and is compatible with all timeframes available in MT4.
3. Is this indicator suitable for all trading strategies?
While the Dorsey Inertia Indicator is versatile, it is recommended to use it in conjunction with other technical analysis tools and indicators to confirm trade signals and enhance decision-making.
Summary
The Dorsey Inertia Forex Indicator for MT4 is a valuable tool for traders seeking to assess the strength and direction of long-term market trends.
Its foundation on the Relative Volatility Index, combined with a smoothing function, provides a clearer picture of market momentum.
By utilizing this indicator, traders can make more informed decisions, identifying potential entry and exit points with greater confidence.
Incorporating the Dorsey Inertia Indicator into your trading strategy can enhance your ability to navigate the complexities of the forex market.


