
About the Double EMA Trading Indicator
The Double EMA Trading Indicator for MT4 is a specialized trend-following tool that utilizes two long-term exponential moving averages to define market bias.
By setting the periods to 144 and 169, this indicator creates a unique “value zone” or channel on the chart.
These specific numbers are derived from Fibonacci sequences and are widely watched by institutional traders to identify major support and resistance levels.
This tool is particularly effective for filtering out low-probability trades by ensuring you are always positioned on the right side of the long-term trend.
It serves as a professional foundation for any MT4 trading strategy that prioritizes stability and trend alignment.
Free Download
Download the “begashole-indicator.mq4” MT4 indicator
Key Features
- Features a dual exponential moving average system using 144 and 169 periods.
- Creates a dynamic trend channel that acts as a zone of institutional support and resistance.
- Provides a clear visual bias: bullish above the channel and bearish below the channel.
- Fully customizable settings allow traders to adapt the EMA periods to any asset or style.
- Works seamlessly as a standalone system or as a primary filter for other indicators.
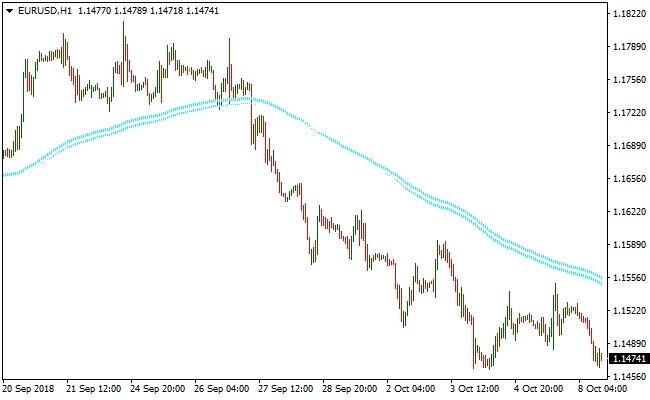
Indicator Chart
The Double EMA Trading Indicator displays two smooth exponential moving average lines directly on the price candles.
This visual setup is designed to keep your chart clean while providing a high-level overview of the current trend health.
Guide to Trade with the Double EMA Trading Indicator
Buy Rules
- Monitor the price as it approaches the 144 and 169 EMA channel from a lower position.
- Wait for a bullish candle to break and close decisively above both moving averages.
- Ensure the slope of the EMAs is beginning to turn upward to confirm the momentum shift.
- Initiate a long position at the opening of the next candle following the breakout.
Sell Rules
- Observe the price action as it moves toward the Double EMA Trading Indicator channel from above.
- Execute a short trade when a bearish candle breaks and closes below both EMA lines.
- Verify that the price is maintaining distance below the channel to confirm bearish conviction.
- Enter the market immediately after the breakout candle has fully formed and closed.
Stop Loss
- For buy trades, place the stop loss below the lower EMA line or the most recent swing low.
- For sell trades, position the stop loss above the upper EMA line or the nearest swing high.
- Adjust the stop level as the EMAs move to lock in profits while giving the trade room to breathe.
Take Profit
- Aim for a profit target at the next major psychological round number or historical resistance.
- Consider exiting the trade if the price closes back inside the EMA channel, signaling a loss of momentum.
- Use a trailing stop that follows the slope of the 144 EMA to capture the maximum length of a trend.
Double EMA + Forex Histogram Scalping Strategy for MT4
This scalping strategy combines the Double EMA Trading MT4 Indicator with the Free Forex Scalping Indicator MT4 to generate fast entry signals.
The Double EMA is used to define trend direction, while the histogram from the Free Forex Scalping Indicator provides momentum confirmation.
The strategy aims for quick trades on short timeframes, targeting small but frequent price moves.
Best used on lower-timeframe charts such as 1-minute (M1), 5-minute (M5), or 15-minute (M15).
Works well on major currency pairs with tight spreads and reasonable volume.
This approach is suited for disciplined scalpers who prefer compact trades with defined entries and exits.
Buy Entry Rules
- Wait until price breaks and closes above both EMAs from below, signaling a bullish trend.
- Confirm momentum: the histogram from the scalping indicator must turn green (buy signal).
- Enter a buy trade immediately after both conditions are met.
- Set stop loss a few pips below the recent swing low or just below the lower EMA to protect against reversals.
- Set take profit at a fixed small target (for example, 8–15 pips) or exit when the histogram turns red (sell signal), or price closes below the lower EMA.
Sell Entry Rules
- Wait until price breaks and closes below both EMAs from above, indicating a bearish trend.
- Confirm momentum: the histogram turns red (sell signal).
- Enter a sell trade immediately after both conditions are met.
- Set stop loss a few pips above the recent swing high or just above the upper EMA.
- Set take profit at a small fixed target (e.g. 8–15 pips) or exit when the histogram turns green (buy signal), or price closes above the upper EMA.
Advantages
- EMA trend filter helps align trades with market direction and reduces false entries.
- Histogram momentum confirmation provides quick, timely entries, which is ideal for scalping.
- Clear and simple rules make the strategy easy to follow under fast market conditions.
- Good for frequent small gains when the market is active and conditions are favorable.
Drawbacks
- In low volatility or choppy markets, price may whip around EMAs leading to false signals and losses.
- Frequent small trades mean spread and slippage can eat into profits if not managed carefully.
Example Case Study 1
On EUR/USD, 5‑minute chart: price closed above both EMAs, then the histogram turned green.
A buy trade was opened. The stop loss was set just below the lower EMA.
The trade captured 12 pips before the histogram turned red and the price closed back inside the EMAs, so the position was exited for a small profit but quick and clean.
Example Case Study 2
On GBP/USD, 1‑minute chart: price broke below both EMAs, histogram turned red.
A sell trade was executed with a stop loss above the upper EMA.
Price moved down, yielding 10 pips, then bounced slightly as the histogram flipped green.
Strategy Tips
- Limit trade duration; scalping works best when you exit quickly after small profits rather than holding too long.
- Use small position sizes because of the frequent trades and potential for multiple small losses.
Download Now
Download the “begashole-indicator.mq4” Metatrader 4 indicator
FAQ
Why are the 144 and 169 periods used in this indicator?
These periods are highly respected in technical analysis because they are closely related to Fibonacci numbers and Gann theory.
Many institutional algorithms use these levels to determine “fair value.”
When the price moves away from this 144/169 zone, it often indicates that a significant new trend is underway, making the Double EMA Trading Indicator a very reliable momentum filter.
How does this indicator handle sideways or ranging markets?
In a ranging market, the price will often crisscross the EMA lines frequently.
To avoid “whipsaws,” professional traders wait for a clear gap to form between the price and the channel.
If the price is hovering inside the 144/169 zone, the market is neutral, and it is usually best to stay on the sidelines until a clear breakout occurs.
Summary
The Double EMA Trading Indicator provides a robust and institutional-grade framework for identifying the dominant market trend.
By focusing on the 144 and 169 exponential moving averages, it helps you ignore minor price fluctuations and stay aligned with the big money flows.
Its simplicity and visual clarity make it a valuable addition to any MT4 platform.
To maximize the effectiveness of this tool, use it to define your primary trading bias before looking for entries.
Combining these EMA levels with price action patterns or volume analysis can significantly increase your win rate.


