
About the Double Support and Resistance Breakout Indicator
The Double Support and Resistance Breakout indicator is a price-based trading tool that automatically identifies two key support levels and two key resistance levels on the chart.
These levels are calculated using the previous trading day’s high and low prices, helping traders focus on the most relevant breakout zones.
By plotting multiple support and resistance lines, the indicator provides a clearer picture of where price pressure is building.
When price breaks beyond these levels and closes decisively, it often signals strong market participation and directional momentum.
The Double Support and Resistance Breakout indicator works great for traders who focus on breakout strategies across different timeframes.
Free Download
Download the “support-resistance-indicator-2.mq4” MT4 indicator
Key Features
- Automatically draws two support and two resistance levels.
- Uses previous day high and low data for accuracy.
- Highlights bullish and bearish breakout zones.
- Works well on both lower and higher timeframes.
- Supports structured breakout trading strategies.
Indicator Chart
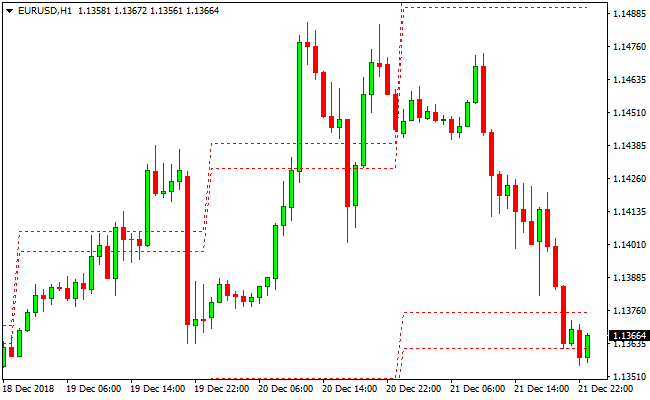
The chart shows the Double Support and Resistance Breakout indicator with clearly marked horizontal levels.
These lines represent potential breakout zones where price may accelerate after closing beyond support or resistance.
Guide to Trade with Double Support and Resistance Breakout Indicator
Buy Rules
- Wait for price to approach the upper resistance level.
- Confirm that a candle closes above the upper resistance line.
- Enter a buy trade after the breakout candle closes.
- Focus on trades during active market sessions.
Sell Rules
- Wait for price to approach the lower support level.
- Confirm that a candle closes below the lower support line.
- Enter a sell trade after the breakout candle closes.
- Focus on trades during active market sessions.
Stop Loss
- Place the stop loss just inside the broken price level.
- Use nearby intraday consolidation as a protection zone.
- Apply a fixed pip stop based on the active timeframe.
- Reduce exposure if price returns inside the range.
Take Profit
- Target the next visible price expansion zone.
- Use a measured move based on the prior daily range.
- Trail profits as long as price holds beyond the breakout level.
- Exit the trade if momentum weakens near resistance or support.
Double Support & Resistance Breakout + TIPU CCI MT4 Scalping Strategy
This scalping strategy combines the Double Support and Resistance Breakout MT4 Indicator with the TIPU CCI MT4 Indicator.
The Double Support and Resistance Breakout indicator signals breakout opportunities when the price closes above the upper resistance line for buys or below the lower support line for sells.
The TIPU CCI adds trend confirmation with blue arrows for bullish momentum and red arrows for bearish momentum.
This combination improves the accuracy of entry signals, making it suitable for M1, M5, and M15 charts.
This strategy is designed for scalpers who want fast, high-probability trades on major currency pairs such as EURUSD, GBPUSD, USDJPY, and AUDUSD.
It emphasizes clear breakout entries with trend confirmation, and all profits are taken at predefined take profit levels without using partial exits.
Buy Entry Rules
- Price bar breaks and closes above the Double Support and Resistance breakout upper resistance line from below.
- TIPU CCI shows a blue arrow, confirming a bullish trend.
- Enter a buy trade at the close of the confirming candle.
- Place a stop loss below the most recent support level.
- Set take profit at the next resistance or target a fixed pip gain depending on pair volatility.
Sell Entry Rules
- Price bar breaks and closes below the Double Support and Resistance breakout lower support line from above.
- TIPU CCI shows a red arrow, confirming a bearish trend.
- Enter a sell trade at the close of the confirming candle.
- Place a stop loss above the most recent resistance level.
- Set take profit at the next support or target a fixed pip gain depending on pair volatility.
Advantages
- Combines breakout signals with trend confirmation for higher probability trades.
- Fast entry and exit suitable for scalping on short timeframes.
- Works on multiple timeframes (M1, M5, M15) for flexibility.
Drawbacks
- Breakouts can produce false signals during low volatility or consolidating markets.
- May generate frequent signals, leading to overtrading if discipline is lacking.
- Not suitable for traders who cannot react quickly or use automated alerts.
Case Study 1 – EURUSD (M5 chart)
The price broke and closed above the upper resistance line at 1.1025.
TIPU CCI displayed a blue arrow confirming bullish momentum.
A buy trade was entered at 1.1026, and a stop loss was placed at 1.1010. Take profit was set at 1.1060.
The trade closed with +34 pips in 15 minutes.
Case Study 2 – GBPUSD (M5 chart)
The price broke and closed below the lower support line at 1.2470.
TIPU CCI showed a red arrow confirming a bearish trend.
A sell trade was entered at 1.2468, stop loss at 1.2485. Take profit was set at 1.2420.
The trade captured 48 pips in 20 minutes.
Strategy Tips
- Only take trades when both the breakout and TIPU CCI arrow confirm the trend direction.
- Prefer major currency pairs with tight spreads for short-term scalping.
- Trade during high volatility sessions for quicker take profit achievement.
- Avoid trading during sideways market periods when support and resistance are not well-defined.
- Keep an eye on spreads and avoid trading when spreads are unusually high.
- Focus on small timeframes (M1, M5, M15) for fast scalping opportunities.
Download Now
Download the “support-resistance-indicator-2.mq4” Metatrader 4 indicator
FAQ
How are the support and resistance levels calculated?
The levels are based on the previous trading day’s high and low prices, highlighting areas where price previously reacted.
Is this indicator suitable for scalping?
Yes, it works well for breakout scalping on lower timeframes when used during high-liquidity sessions.
Does the indicator repaint its levels?
No, once the levels are plotted for the day, they remain fixed until the next trading session.
Summary
The Double Support and Resistance Breakout indicator focuses on one of the most effective trading concepts: price breaking beyond key levels.
Marking multiple daily support and resistance zones helps traders spot breakout opportunities with greater precision.
Its clean layout and rule-based signals make it easy to track price behavior across timeframes.
The indicator works well for traders who prefer trading momentum moves that follow decisive price expansion.


