
About the DSS Bressert Indicator
The DSS Bressert Indicator for MT4 combines stochastic logic with EMA smoothing to highlight short-term trend changes and momentum shifts.
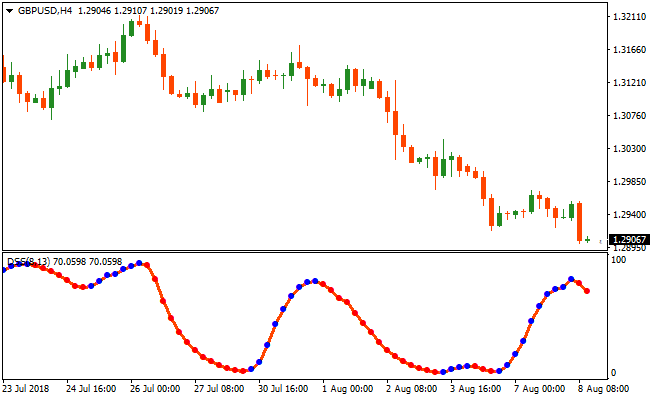
The indicator oscillates between 0 and 100 and plots colored dots in a separate window below the price chart.
Blue dots reflect bullish momentum, while red dots point to bearish pressure.
This makes it easy to align entries with short-term trend direction.
By blending stochastic sensitivity with EMA filtering, the DSS Bressert indicator reduces noise and highlights meaningful price swings.
Traders use it to time pullbacks within trends rather than chasing extended moves.
For best results, many traders combine DSS Bressert with a higher-timeframe trend filter such as a 200-period moving average.
Free Download
Download the “dss-bressert-colored.mq4” MT4 indicator
Key Features
- Combines stochastic oscillation with EMA-based smoothing.
- Plots clear blue and red dots for directional bias.
- Oscillates between 0 and 100 to highlight overbought and oversold zones.
- Fits scalping, intraday trading, and swing setups.
Indicator Chart
The DSS Bressert Indicator appears beneath the main price display in its own panel.
The colored dots highlight short-term momentum shifts and potential trade entries.
Traders use these dots to confirm pullbacks and short-term reversals within the prevailing trend.
Guide to Trade with DSS Bressert Indicator
Buy Rules
- Confirm the higher-timeframe trend is bullish.
- Wait for the indicator to pull back into the 0–20 zone.
- Watch for the first blue dot to appear.
- Enter a buy trade at the close of the signal candle.
Sell Rules
- Confirm the higher-timeframe trend is bearish.
- Wait for the indicator to rise into the 80–100 zone.
- Watch for the first red dot to appear.
- Enter a sell trade at the close of the signal candle.
Stop Loss
- Set the stop a fixed number of pips beyond the entry candle.
- Increase the buffer slightly during high-volatility sessions.
- Keep the stop outside recent minor consolidation zones.
- Move the stop to break-even once price pushes decisively in your favor.
Take Profit
- Close the trade when the indicator prints an opposite-colored dot.
- Alternatively, target nearby support or resistance.
- Lock profits early during ranging conditions.
DSS Bressert EMA Stochastic and Pivot Fibonacci Lines MT4 Forex Strategy
This MT4 forex strategy combines the DSS Bressert EMA Stochastic Indicator with the Pivot Fibonacci Lines Indicator to create a trend-aligned scalping and intraday system.
The Pivot Fibonacci Lines provide dynamic trend direction based on candlestick closes above or below pivot points, while the DSS Bressert EMA Stochastic generates precise buy and sell signals with its blue and red dotted lines.
Together, they filter high-probability trades in the direction of the main trend.
It focuses on entering trades with strong momentum confirmation while using pivot points to identify trend direction.
Buy Entry Rules
- The candlestick closes above the Pivot Fibonacci pivot point, indicating a bullish trend.
- The DSS Bressert EMA Stochastic blue dotted signal line appears, confirming buy momentum.
- Enter a buy trade at the close of the signal candle.
- Place the stop loss below the nearest pivot support level or recent swing low.
- Exit the trade when the DSS Bressert EMA Stochastic red dotted line appears or price closes below the pivot point.
Sell Entry Rules
- The candlestick closes below the Pivot Fibonacci pivot point, indicating a bearish trend.
- The DSS Bressert EMA Stochastic red dotted signal line appears, confirming sell momentum.
- Enter a sell trade at the close of the signal candle.
- Place the stop loss above the nearest pivot resistance level or recent swing high.
- Exit the trade when the DSS Bressert EMA Stochastic blue dotted line appears or price closes above the pivot point.
Advantages
- Combines trend direction with precise momentum signals for high-probability trades.
- Pivot points provide dynamic support and resistance levels for logical trade placement.
- Helps avoid countertrend trades by requiring alignment of pivot trend and stochastic signal.
- Works well on major pairs with high liquidity.
- Supports consistent trading through repeatable, rule-based entries.
Drawbacks
- Signals can lag during sudden price spikes or high-impact news events.
- Stop placement must be precise to avoid being stopped out on minor retracements.
- False DSS Bressert EMA Stochastic signals may occur if the pivot trend is weak.
- Pivot points may not be as effective in thinly traded or volatile pairs.
Case Study 1
On AUDUSD M5, the candlestick closed above the Pivot Fibonacci pivot point, indicating a bullish trend.
The DSS Bressert EMA Stochastic blue dotted line appeared, signaling a buy.
A long trade was entered at candle close with the stop below the pivot support level.
Price moved fast upward, gaining 18 pips in only 20 minutes before the red dotted line appeared, signaling exit.
Case Study 2
On GBPUSD M15, the candlestick closed below the pivot point, showing a bearish trend.
The DSS Bressert EMA Stochastic red dotted line appeared, signaling a sell.
A short trade was opened at candle close with the stop above the pivot resistance.
Price dropped slowly, and the trade gained 27 pips after 2 hours before the blue dotted line appeared, prompting exit.
Strategy Tips
- Always ensure that the pivot trend and stochastic signal align before taking a trade.
- Focus on high-liquidity sessions to reduce noise and increase the accuracy of signals.
- Use recent swing highs and lows for logical stop placement.
- Monitor higher timeframe pivot points to confirm trend direction and strengthen signal reliability.
- Consider using trailing stops along the pivot support or resistance levels to lock in profits.
- Limit trades to periods of clear trend direction to reduce false entries.
Download Now
Download the “dss-bressert-colored.mq4” Metatrader 4 indicator
FAQ
Is the DSS Bressert Indicator better suited for trending or ranging markets?
It performs best when the market shows directional bias. In strong trends, pullbacks from extreme levels tend to produce higher-quality signals.
Do the dot colors change during an open candle?
Dots may appear intrabar, but traders should always wait for candle close to confirm the signal and avoid premature entries.
How sensitive is the indicator to parameter changes?
Small adjustments can noticeably affect signal frequency. Faster settings increase activity, while slower values favor stability.
Can this indicator be combined with price action?
Yes. Many traders wait for price to react at key levels before acting on a dot signal, which helps filter lower-probability setups.
Summary
The DSS Bressert Indicator offers a practical way to track short-term momentum shifts using stochastic logic and EMA filtering.
Its dot-based signals help traders focus on pullbacks rather than late entries.
The indicator adapts to multiple trading styles and works across all currency pairs.
While it performs well on its own, pairing it with a higher-timeframe trend filter can further refine trade selection and consistency.


