The Ehlers Fisher MTF forex indicator for MT4 is a popular dual-colored buy and sell signals oscillator that works on multiple time frames.
Ehlers Fisher works well for finding short-term trade opportunities in established market trends.
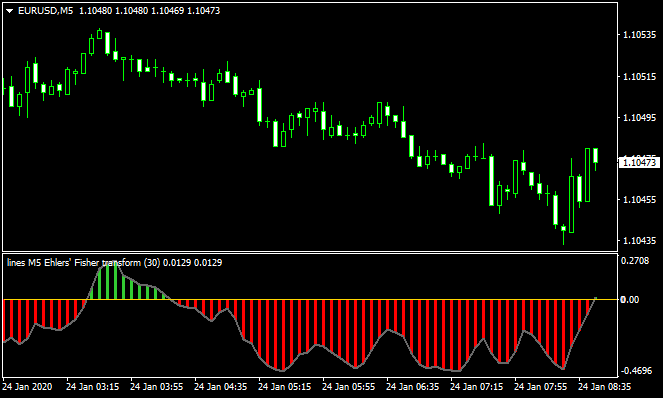
The Ehlers Fisher indicator oscillates above and below its neutral zero line (0.00).
- When the Ehlers Fisher indicator breaks above the zero line from below, the short-term trend changes from negative to positive (look to buy).
- When the Ehlers Fisher indicator breaks below the zero line from above, the short-term trend changes from positive to negative (look to sell).
In brief, when the Ehlers Fisher indicator draws green bars, the short-term trend is up.
When the Ehlers Fisher indicator draws red bars, the short-term trend is down.
In order to avoid trading against the longer-term trend, combine the indicator with a longer-period moving average (type: SMA, EMA).
Combine for example with: 200 period SMA or 100 period EMA.
Longer-term trend up? Trade the green Ehlers Fishers bars.
Longer-term trend down? Trade the red Ehlers Fishers bars.
Feel free to experiment with the different indicator’s inputs settings to suit your needs and preferences.
Free Download
Download the “ehlers-fisher-transform-mtf.ex4” MT4 indicator
Indicator Chart (EUR/USD M5)
The EUR/USD 5-Minute chart below displays the Ehlers Fishers MTF Metatrader 4 forex indicator in action.
Basic Trading Signals
Signals from the Ehlers Fishers MTF MT4 forex indicator are easy to interpret and goes as follows:
Buy Signal: Initiate buy trade when the Ehlers Fishers MTF bars turn green from red. The short-term trend is up.
Place a stop loss below support or use your own preferred SL method.
Sell Signal: Initiate sell trade when the Ehlers Fisher MTF bars turn red from green. The short-term trend is down.
Place a stop loss above resistance or use your own preferred SL method.
Ehlers Fisher MTF + Trend Logic MT4 Day Trading Strategy
This MT4 day trading strategy combines the Ehlers Fisher MTF indicator with the Trend Logic indicator.
Ehlers Fisher MTF shows a histogram: green bars signal bullish momentum, red bars signal bearish momentum.
Trend Logic uses a colored line: a green line indicates a bullish trend, while a red line suggests a bearish trend.
By combining these two, you can trade with the trend while also capturing strong intraday momentum.
This strategy is ideal for M15 and H1 charts, and for traders who want structured entries and exits during active trading sessions like London and New York.
Buy Entry Rules
- Wait for the Ehlers Fisher MTF histogram to turn green, indicating bullish momentum.
- Confirm that the Trend Logic line is green, signaling a bullish trend.
- Enter a long position at the close of the confirming candle.
- Place a stop loss a few pips below the recent swing low or structure level.
- Set take profit to target a 1.5:1 or 2:1 reward-to-risk ratio, or use nearby resistance levels for exit.
Sell Entry Rules
- Wait for the Ehlers Fisher MTF histogram to turn red, indicating bearish momentum.
- Confirm that the Trend Logic line is red, signaling a bearish trend.
- Enter a short position at the close of the confirming candle.
- Place a stop loss a few pips above the recent swing high or structure level.
- Set take profit to target a 1.5:1 or 2:1 reward-to-risk ratio, or use nearby support levels for exit.
Advantages
- The combination of momentum (Fisher) and trend (Trend Logic) delivers more reliable entries.
- Clear visual confirmation with a histogram and a line makes decision‑making easier.
- Scalable across different timeframes: works on M15 and H1.
- Helps filter out low‑momentum noise by requiring both indicators to align.
- Flexible take profit options using fixed risk ratio or structure levels.
Drawbacks
- In choppy markets, the histogram may flip frequently, producing false signals.
- Stop losses may be relatively wide, especially on H1, which can reduce net profitability.
- Trend Logic may lag in very fast, sharp reversals.
- Requires discipline to wait for both indicators to confirm before entering.
- Less effective during very low volatility or when markets are flat.
Example Case Study 1
On EURUSD H1 during the London‑New York overlap, the Ehlers Fisher MTF histogram turned green, showing increasing bullish momentum.
At the same time, the Trend Logic line was clearly green, confirming a strong uptrend.
A buy trade was opened at 1.1085 when the hourly candle closed, with a stop loss placed at 1.1065, just below the recent swing low (20 pips risk).
Price continued to rise steadily. Over the next three hours, EURUSD moved about 40 pips upward to 1.1125, hitting a 2:1 take profit target.
The Fisher histogram remained green, and the Trend Logic line stayed green, reinforcing that the trend and momentum were aligned.
Example Case Study 2
On AUDUSD M15 during the New York session, the Fisher histogram flipped red after a pullback, indicating bearish momentum.
The Trend Logic line had turned red earlier, signaling a broader downtrend.
A short position was taken at 0.6742 when the 15‑minute candle closed, with a stop loss placed at 0.6760 (18 pips), just above a recent swing high.
The pair dropped quickly, with momentum favoring the short trade.
Within about an hour, AUDUSD slid to 0.6708, yielding 34 pips and meeting a 1.8:1 reward-to-risk target.
The Fisher histogram stayed red, and the Trend Logic line remained red, confirming the strong downward movement.
Strategy Tips
- Trade during high‑liquidity sessions like London or New York for the best momentum.
- Use higher timeframes (H1) for trend identification and lower timeframes (M15) for entry timing.
- Consider partially closing your position when the price hits a major structure level to lock in profits.
- Use a trailing stop once the trade moves in your favor and the Fisher histogram continues to support your direction.
- Backtest the strategy on different currency pairs such as EURUSD, AUDUSD, GBPJPY, or USDCAD to find where it performs best.
Download Now
Download the “ehlers-fisher-transform-mtf.ex4” Metatrader 4 indicator
MT4 Indicator Characteristics
Currency pairs: Any
Platform: Metatrader 4
Type: chart window indicator
Customization options: Variable (time frame, period, price type, price smoothing, index smoothing, alerts) Width & Style.
Time frames: 1-Minute, 5-Minutes, 15-Minutes, 30-Minutes, 1-Hour, 4-Hours, Daily, Weekly, Monthly
Type: oscillator

