About the Elliott Wave Oscillator Indicator
The Elliott Wave Oscillator is a free MetaTrader 4 indicator that converts Elliott Wave momentum into a simple and practical buy and sell histogram.
Instead of manually counting waves, the indicator measures market acceleration and displays it as a colored gray histogram that moves above and below the 0.00 midpoint.
This approach allows traders to focus on momentum shifts rather than complex wave labeling.
When the histogram crosses the midpoint, it reflects a change in directional pressure that often aligns with trend continuation or early reversals.
The default settings use periods 5 and 35, which are well balanced for short-term and intraday trading.
The Elliott Wave Oscillator appears in a separate MT4 chart window, keeping the main price chart clean and readable.
Free Download
Download the “elliot-waves-oscillator.mq4” indicator for MT4
Key Features
- Blue histogram displayed in a separate MT4 window
- Oscillates above and below the 0.00 midpoint
- Default periods set to 5 and 35
- Provides momentum-based buy and sell signals
- Useful for entries, exits, and trade confirmation
- Works on all forex pairs and timeframes
Indicator Chart
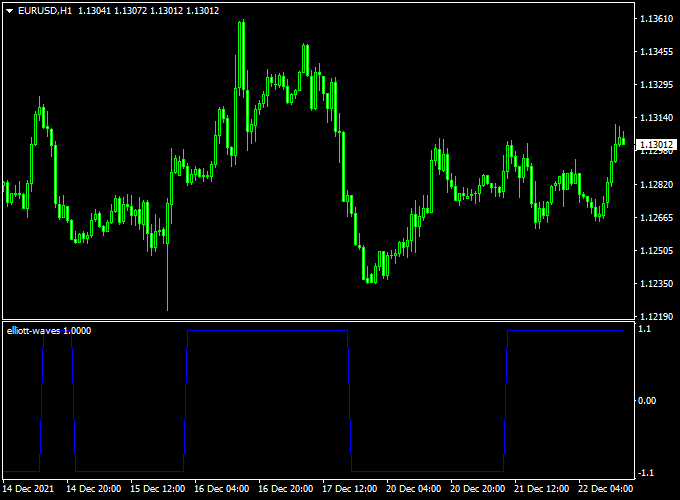
The chart below shows the Elliott Wave Oscillator indicator applied to a forex price chart.
The blue histogram moves above and below the 0.00 midpoint, highlighting shifts in bullish and bearish momentum.
Buy signals occur when momentum turns positive, while sell signals appear when momentum turns negative.

Guide to Trade with Elliott Wave Oscillator
Buy Rules
- Wait for the histogram bars to move below the 0.00 midpoint
- Open a buy trade when the histogram crosses above the midpoint from below
- Confirm the trade with upward price movement or a supportive trend
Sell Rules
- Wait for the histogram bars to move above the 0.00 midpoint
- Open a sell trade when the histogram crosses below the midpoint from above
- Confirm the trade with downward price movement or resistance pressure
Stop Loss
- Set a fixed stop loss based on the active timeframe
- Use tighter stops for lower timeframes and wider stops for higher timeframes
- Close the trade if the histogram makes a strong move back across the 0.00 midpoint
- Adjust risk so the stop loss remains consistent across different pairs
Take Profit
- Target nearby support or resistance levels
- Exit the trade when the histogram starts losing momentum
- Close the position if the histogram crosses back in the opposite direction
Elliott Wave Oscillator + Renko Boxes MT4 Strategy
This strategy combines the momentum-biasing power of the Elliott Wave Oscillator with the price movement clarity of the Renko Boxes Forex Indicator.
The idea is that the Renko structure filters out time-based noise, while the oscillator confirms directional strength.
Use this setup on trending pairs like EUR/AUD, USD/JPY, or GBP/USD. Best on timeframes M30, H1, or H4.
It works because Renko charts respond only to price movement (so flat choppy periods collapse), and the Elliott Wave Oscillator highlights momentum shifts.
When a Renko breakout coincides with oscillator confirmation, the trade has structural and momentum alignment.
Buy Entry Rules
- Renko Boxes show a fresh blue bullish bar on the chart.
- The Elliott Wave Oscillator has a 1.1 indicator reading.
- Enter a buy at the open of the next Renko bar or the next real-time candle after confirmation.
- Stop loss: a few pips below the recent Renko swing low.
- Take profit: target a risk: reward of 1:2 or aim for the next major resistance as defined by price zones on the original time chart.
Sell Entry Rules
- Renko Boxes show a fresh red bearish bar on the chart.
- The Elliott Wave Oscillator has a -1.1 indicator reading.
- Enter a sell at the open of the next Renko bar.
- Stop loss: a few pips above the recent Renko swing low.
- Take profit: target a risk: reward of 1:2 or aim for the next major support zone.
Advantages
- Renko filters out sideways (“time”) noise so you see only meaningful moves.
- The Elliott Wave Oscillator adds momentum confirmation so you avoid weak signals.
- More disciplined entries — both price structure and momentum must agree.
- Works across multiple pairs and timeframes (especially trending markets).
Drawbacks
- During consolidation, Renko may produce few or no signals.
- If the box size is poorly chosen, signals may lag or be too frequent.
- Requires backtesting for optimal box size per pair and timeframe.
Case Study 1: USD/JPY on H1
On USD/JPY H1, the Renko Boxes (with box size ~ 12 pips) flipped bullish and produced a new blue Renko bar breaking above the last top.
Simultaneously, the Elliott Wave Oscillator reached the 1.1 indicator reading.
Entered a buy at the next candle high.
The stop was placed a few pips below the recent Renko support.
The trade ran until the EW oscillator began flattening, capturing a solid move before reversal.
Case Study 2: EUR/AUD on M30
On EUR/AUD M30, Renko boxes (box size ~ 15 pips) turned bearish, giving a fresh red brick.
The Elliott Wave Oscillator reached the -1.1 reading.
A sell entered at the next candle.
The stop was above the prior Renko high.
Price dropped strongly, reaching profit targets before any sharp retracement.
Strategy Tips
- Choose Renko box size relative to pair volatility. Use ATR or historical average to set it.
- Test the combination on a demo before going live.
- Watch sessions: avoid entering just before major news releases.
- Use an original candlestick chart support/resistance to help set take profit zones.
- Adjust stop and target based on pair and timeframe.
Download Now
Download the “elliot-waves-oscillator.mq4” indicator for Metatrader 4
FAQ
What makes this oscillator different from other momentum indicators?
The Elliott Wave Oscillator focuses on wave-based momentum rather than simple overbought or oversold levels. This helps traders identify trend phases instead of short-term price noise.
Are the default settings suitable for all traders?
The default 5 and 35 periods work well for most trading styles. Traders can adjust them to generate faster or slower signals depending on their preferences.
Can the Elliott Wave Oscillator be used as a filter?
Yes, many traders use it to confirm entries from other indicators by only trading in the direction of the histogram momentum.
Does the indicator repaint signals?
Once a histogram bar is closed, its value remains fixed. This allows traders to analyze signals with confidence.
Summary
The Elliott Wave Oscillator is a reliable MT4 indicator for traders who want to trade momentum without complex wave analysis.
Its histogram-based signals make it easy to spot potential buy and sell opportunities across all forex markets.
With flexible usage, simple settings, and compatibility with other trading tools, the Elliott Wave Oscillator can enhance both entry timing and trade management when applied with proper risk control.


