About the EMA Levels Indicator
The EMA Levels indicator is a free MetaTrader 4 tool designed to provide multiple exponential moving average levels on the chart, helping traders identify trend direction across several timeframes.
By plotting H1, H4, and D1 EMAs, the indicator gives a clear view of short-term and major trends simultaneously.
The indicator appears in the main MT4 chart window as three colored lines—green, blue, and red—representing different timeframe EMAs.
Traders can use these lines to identify potential buy and sell opportunities based on price interactions with key EMA levels.
EMA Levels is versatile and can be used on forex, CFDs, cryptocurrencies, indices, and commodities.
It works well for scalping, day trading, and intraday strategies, especially during the London and U.S. trading sessions when market volatility is higher.
It can also serve as confirmation for other trading strategies or as a standalone entry system.
Free Download
Download the “ema-levels.mq4” indicator for MT4
Key Features
- Three EMA levels based on H1, H4, and D1 timeframes
- Green, blue, and red lines representing different trend horizons
- Helps identify short-term and major trends simultaneously
- Works on all assets including Forex, CFDs, stocks, indices, crypto, and commodities
- Optimized for London and U.S. trading sessions
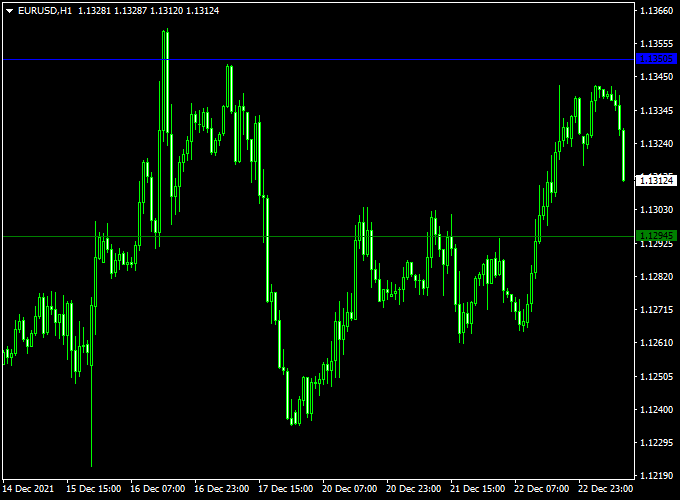
Indicator Chart
The chart below shows the EMA Levels indicator applied to a forex pair.
The three colored EMAs indicate trend direction across multiple timeframes.
Buy opportunities occur when price closes above the blue EMA line during an uptrend, while sell opportunities appear when price closes below the green EMA line in a downtrend.

Guide to Trade with EMA Levels Indicator
Buy Rules
- Price closes above the blue EMA line
- Confirm the entry with supportive price action
Sell Rules
- Price closes below the green EMA line
- Confirm the entry with bearish price action
Stop Loss
- Place the stop loss below the nearest support level for buy trades and above resistance for sell trades
- Adjust position size so the risk remains consistent across trades
- Apply slightly tighter stops during high-liquidity sessions such as London
Take Profit
- Target the next significant EMA line or visible support/resistance level
- Use a risk-to-reward ratio higher than 1:1 for consistency
- Scale profit targets according to market volatility and timeframe
- Focus on achieving steady gains rather than chasing large moves
EMA Levels + EW Trend Scalping MT4 Strategy
This strategy combines the EMA Levels Forex Indicator (MT4) with the EW Trend Indicator for Scalping (MT4).
It is designed for short to medium time frames and aims to capture clean trend moves with limited risk.
The EMA Levels provide dynamic support and resistance, while the EW Trend indicator filters entries for high probability scalps and swing trades.
Intro
This method works because it aligns momentum with a clear price structure.
EMA Levels create zones where price often stalls or reverses.
The EW Trend indicator shows whether momentum favors buyers or sellers.
When both tools agree, the edge increases.
Use this on M5, M15, and H1. Traders who prefer fast decision-making will opt for M5 and M15.
Swing traders can use H1 to take stronger moves. It suits traders who want a simple rules set, tight risk control, and repeatable entries.
Buy Entry Rules
- Price must be above the main EMA level or bounce off a lower EMA level from the EMA Levels indicator.
- The EW Trend indicator must turn back above the zero level.
- Enter on the first bullish candle that closes above the bounce level or after a clear break and retest of the EMA level.
- Stop loss: place below the most recent swing low or below the EMA level used as the bounce reference (whichever is lower). Keep SL tight on M5, wider on H1.
- Take profit: target 1.5 to 2 times the risk for scalps. For swing trades, aim for the next EMA resistance level or a fixed 40–80 pips, depending on pair and timeframe.
Sell Entry Rules
- Price must be below the main EMA level or reject an upper EMA level from the EMA Levels indicator.
- The EW Trend indicator must cross back below the zero level.
- Enter on the first bearish candle that closes below the rejection level or after a clear break and retest of the EMA level.
- Stop loss: place above the most recent swing high or above the EMA level used as the rejection reference.
- Take profit: target 1.5 to 2 times the risk for scalps. For longer holds, use the next EMA support or 40–80 pips, depending on pair and timeframe.
Advantages
- Works across pairs and time frames with small adjustments.
- EMA Levels give visual zones for targets and stops.
- The EW Trend filter reduces false entries during chop.
Drawbacks
- Performance drops during strong ranging markets.
- Requires patience; some setups will be rare on higher time frames.
- Needs discipline to exit or scale out according to plan.
Example Case Study 1 — M15 EURUSD (Scalp)
Price bounced off the 50 EMA level shown by EMA Levels. EW Trend turned back above the zero level.
A buy entry was taken on the close of a bullish candle. Stop loss placed 12 pips below the swing low.
Take profit set at 24 pips for a 1:2 risk reward. Trade closed at the target. Result: +24 pips.
Example Case Study 2 — H1 GBPUSD (Swing)
On H1, the price broke above the main EMA level and retested it. The EW Trend indicator crossed back above 0.
A buy entry after retest with a stop 45 pips below the retest low.
Target was the next EMA resistance and a conservative 80 pip target.
Price moved in favor and hit the target over two trading sessions. Result: +80 pips.
Strategy Tips
- Trade pairs with good spreads and liquidity. Avoid exotic pairs for scalps.
- Adjust the stop and target to the timeframe. Smaller timeframes need tighter SL and lower TP multiples.
- Use a small fixed risk per trade, for example, 0.5–1% of equity.
- Consider partial exits: close half at 1:1 and move SL to breakeven for the remainder.
Download Now
Download the “ema-levels.mq4” indicator for Metatrader 4
FAQ
Which timeframes does EMA Levels cover?
The indicator plots EMAs from H1, H4, and D1, giving a comprehensive view of short-term and major trends.
Can EMA Levels be used on multiple assets?
Yes, the indicator works effectively on forex, CFDs, stocks, indices, cryptocurrencies, and commodities.
Is this indicator suitable for intraday trading?
Yes, it is especially effective during London and U.S. trading sessions due to higher volatility and liquidity.
Can it be combined with other indicators?
Traders often combine EMA Levels with oscillators or trend indicators to confirm entries and reduce false signals.
Summary
The EMA Levels indicator is a versatile MT4 tool that allows traders to monitor trends across multiple timeframes with ease.
Its colored EMA lines provide clear insight into short-term and major market trends.
EMA Levels can enhance both entry timing and overall trading strategy for a variety of assets.


