About the Envelopes Indicator
The Envelopes indicator for MetaTrader 4 is a free tool that plots a trading channel on the chart, helping traders identify the real market trend.
The indicator displays colored envelope bands—yellow and red—on the main MT4 chart window, providing visual guidance for potential trade entries.
By monitoring price interactions with the envelope bands, traders can spot high-probability buy and sell opportunities.
A touch of the lower red band in a rising channel can indicate a buy setup, while a touch of the upper yellow band in a falling channel can indicate a sell setup.
Envelopes can also complement other indicators or trading strategies as an additional confirmation tool, increasing confidence in trade entries.
Free Download
Download the “Envelopes.mq4” indicator for MT4
Key Features
- Plots envelope trading channels on the MT4 chart
- Shows the real market trend visually
- Identifies potential buy and sell opportunities
- Effective for scalping, intraday, and swing trading
- Can be used alone or combined with other tools for confirmation
Indicator Chart
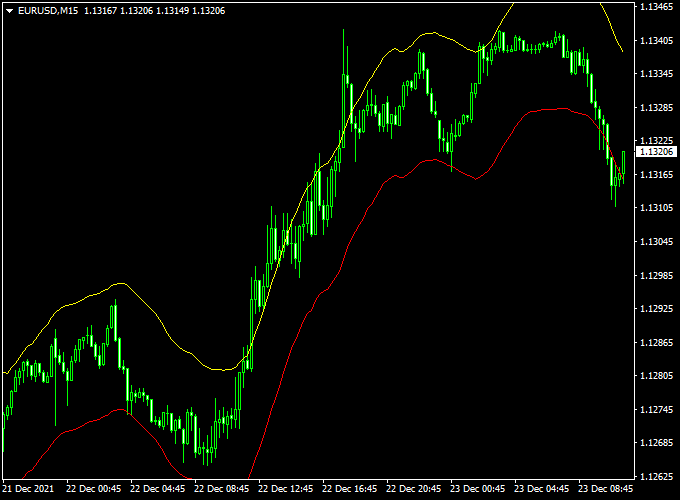
The chart below illustrates the Envelopes indicator. The yellow and red bands form a channel that highlights trend direction.
Candlesticks touching the lower red band in an uptrend signal potential buys, while touching the upper yellow band in a downtrend signal potential sells.
This makes it easier to spot trade opportunities within the trend.

Guide to Trade with Envelopes Indicator
Buy Rules
- Candlestick touches the lower red band
- Envelope bands are rising, indicating an uptrend
- Open a buy trade in alignment with the trend
Sell Rules
- Candlestick touches the upper yellow band
- Envelope bands are falling, indicating a downtrend
- Open a sell trade in alignment with the trend
Stop Loss
- Place stops a few pips outside the opposite envelope band
- Adjust for volatility and session activity
- Keep risk consistent using proper position sizing
Take Profit
- Set fixed pip targets based on the channel width or recent volatility
- Close trades when price touches the opposite envelope band
- Maintain a favorable risk-reward ratio (1:1.5 or higher)
Envelope + Sibbet Demand Index Divergence MT4 Intraday Strategy
Introduction
This intraday strategy combines the Envelopes Indicator and the Sibbet Demand Index Divergence Indicator on the MT4 platform to identify high-probability reversal points and trend shifts.
The Envelopes Indicator helps detect overbought and oversold levels across all timeframes.
The Sibbet Demand Index Divergence Indicator identifies divergences between price action and demand strength, providing insights into potential trend reversals.
Buy Entry Rules
- Price touches or breaks below the lower envelope line of the Envelopes Indicator, indicating an oversold condition.
- The Sibbet Demand Index Divergence Indicator turns back above the zero level (green color).
- Enter a buy position at the close of the candle that confirms both conditions.
- Stop Loss: Place below the recent swing low or a fixed number of pips, depending on the currency pair’s volatility.
- Take Profit: Set at a risk-to-reward ratio of 1:2 or at the next significant resistance level.
Sell Entry Rules
- Price touches or breaks above the upper envelope line of the Envelopes Indicator, indicating an overbought condition.
- The Sibbet Demand Index Divergence Indicator crosses back below 0 (red color).
- Enter a sell position at the close of the candle that confirms both conditions.
- Stop Loss: Place above the recent swing high or a fixed number of pips, depending on the currency pair’s volatility.
- Take Profit: Set at a risk-to-reward ratio of 1:2 or at the next significant support level.
Advantages
- Helps identify precise reversal points using divergence and overbought/oversold conditions.
- Allows traders to scale out of positions for partial profits, reducing risk.
- Suitable for intraday trading across multiple pairs and timeframes.
- Combining two indicators increases the probability of high-quality trades compared to using a single indicator.
Drawbacks
- Requires patience, as setups may not appear frequently in low-volatility markets.
- Partial exits may lead to missed larger moves if not managed carefully.
Example Case Study 1 — EUR/USD, 15m
During a period of consolidation, the price touched the lower envelope line, indicating an oversold condition.
Simultaneously, the Sibbet Demand Index Divergence Indicator showed a green bullish divergence, suggesting increasing demand.
A buy position was entered at the close of the confirming candle.
The price moved upward, hitting the take profit target at the next resistance level, resulting in a successful trade.
Example Case Study 2 — GBP/USD, 5m
After a strong upward movement, the price touched the upper envelope line, indicating an overbought condition.
The Sibbet Demand Index Divergence Indicator then showed a red bearish divergence below zero, suggesting decreasing demand.
A sell position was entered at the close of the confirming candle.
The price declined, reaching the take profit target at the next support level, yielding a profitable trade.
Strategy Tips
- Look for confluence with support and resistance levels on higher timeframes to increase accuracy.
- Set alerts on MT4 for envelope touches or divergence signals to avoid missing intraday opportunities.
- Manage risk by limiting the total number of trades per session to prevent overtrading.
- Consider adjusting the envelope period slightly based on market volatility for different currency pairs.
Download Now
Download the “Envelopes.mq4” indicator for Metatrader 4
FAQ
What do the colored envelope bands represent?
The yellow and red bands form a channel showing the market trend. The lower band signals potential support, while the upper band signals potential resistance.
Can the indicator be used for scalping?
Yes, it is effective on lower timeframes like M5 and M15 for short-term trades, as well as higher timeframes for intraday setups.
Do the bands adjust automatically to market volatility?
Yes, the envelope bands adapt based on price movements, providing dynamic levels that reflect current market conditions.
Is it possible to combine Envelopes with other indicators?
Absolutely. Using it alongside momentum or trend indicators can improve trade confirmation and reduce false signals.
Summary
The Envelopes indicator is a practical MT4 tool that highlights trend direction and potential trade opportunities.
Its colored channel bands provide an easy-to-read visual guide for entering buy or sell trades.
With proper risk management, stop loss placement, and take profit targets, traders can use the Envelopes indicator alone or in combination with other tools to enhance their trading strategy and improve profitability.


