About the FATL Pulsback Indicator
The FATL Pulsback Indicator for MT4 is a trend-following tool that uses four moving averages to identify crossover points, providing clear buy and sell signals.
Displayed directly on the MT4 chart, it allows traders to spot market reversals and follow momentum with minimal guesswork.
By observing the interaction of the four colored moving averages, traders can quickly detect potential trading opportunities.
This crossover system works on any timeframe and currency pair, making it flexible for scalping, intraday, or swing trading strategies.
The FATL Pulsback system can be used independently or combined with other indicators to confirm trend direction and improve trade accuracy.
Free Download
Download the “fatl-plusback-indicator.mq4” indicator for MT4
Key Features
- Four moving averages that generate signals through crossovers
- The red moving average acts as the main trigger for buy and sell trades
- Suitable for trend-following, scalping, and day trading
- Works on all MT4-compatible currency pairs and timeframes
- Provides visual clarity for trend direction and momentum
- Can be used alongside other technical tools for confirmation
Indicator Chart
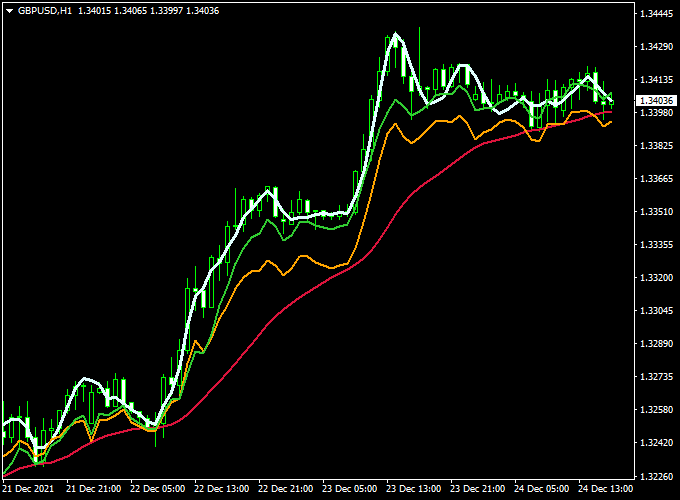
The chart below demonstrates the FATL Pulsback Indicator in action on MT4.
Buy trades are signaled when price closes above the red moving average, while sell trades are triggered when price closes below it.
The crossover of the other three moving averages enhances trend confirmation and helps traders make better entry and exit decisions.

Guide to Trade with FATL Pulsback Indicator
Buy Rules
- Enter a buy trade when the candlestick closes above the red moving average
- Confirm trend strength with the alignment of the remaining three moving averages
- Check higher timeframes to ensure overall market momentum supports the buy
- Look for bullish candlestick patterns or other technical confirmation near the red line
Sell Rules
- Enter a sell trade when the candlestick closes below the red moving average
- Confirm trend direction with the alignment of the other three moving averages
- Verify that higher timeframe trends support a downward move
- Look for bearish candlestick signals or resistance areas near the red line
Stop Loss
- Place stop loss slightly beyond the most recent swing high for sells or swing low for buys
- Adjust stop levels based on the asset’s volatility and chosen timeframe
Take Profit
- Set take profit near the next significant support (for buys) or resistance (for sells)
- Close trades if the price crosses back over the red moving average in the opposite direction
- Use trailing stops during strong trends to maximize profit potential
Practical Tips
- Combine FATL Pulsback with oscillators like RSI or MACD for extra confirmation
- Focus on liquid pairs for better signal reliability
- Trade during active sessions to ensure stronger price reactions at moving averages
FATL Pullback Indicator + DSL DMI Oscillator Forex Scalping Strategy for MT4
This scalping strategy combines the FATL Pullback Forex Indicator with the DSL DMI Oscillator Indicator.
The FATL Pullback identifies price direction through its red moving average, while the DSL DMI Oscillator filters out weak signals by confirming momentum above or below its zero line.
This setup works best on M1 to M15 charts for quick trades during high-volume sessions. It’s ideal for traders who want clear rules for entries and exits.
Setup
- Apply the FATL Pullback indicator to your chart.
- Apply the DSL DMI Oscillator to the same chart.
- Use liquid currency pairs (EURUSD, GBPUSD, USDJPY, XAUUSD).
- Trade during the London and New York sessions for better volatility.
Buy Entry Rules
- Price must close above the red moving average of the FATL Pullback indicator.
- The DSL DMI Oscillator must be trading above the zero line and draw the start of a green line (bullish momentum).
- Enter a market buy at the close of the confirming candle.
- Stop loss: a few pips below the red moving average or the last swing low.
- Take profit: target the next intraday support/resistance level or 8–15 pips on M1/M5 charts, depending on volatility.
- Exit early if price closes back below the red moving average or DSL turns red below zero.
Sell Entry Rules
- Price must close below the red moving average of the FATL Pullback indicator.
- The DSL DMI Oscillator must be trading below the zero line and draw the start of a red line (bearish momentum).
- Enter a market sell at the close of the confirming candle.
- Stop loss: a few pips above the red moving average or the last swing high.
- Take profit: target the next intraday support/resistance level or 8–15 pips on M1/M5 charts, depending on volatility.
- Exit early if price closes back above the red moving average or DSL turns green above zero.
Advantages
- Two-indicator confirmation reduces false signals.
- Clear visual entries and exits are suitable for fast trading.
- Works well during strong momentum sessions.
- Flexible profit targets based on intraday volatility.
Drawbacks
- Choppy or low-volume markets may produce whipsaws.
- Requires strict stop losses to protect against reversals.
- Frequent trades may lead to spread/slippage costs on small timeframes.
- Signals can appear late if volatility spikes.
Example Case 1 — EURUSD, 5-Minute Buy
Price closes above the FATL Pullback red MA while DSL DMI is above zero, drawing a green line.
You enter a buy with a 6-pip stop and target 12 pips.
Price rallies quickly to the next resistance, where you close for +12 pips profit.
Example Case 2 — GBPUSD, 1-Minute Sell
A quick downtrend develops. Price closes below the red MA while DSL DMI is below zero, drawing a red line.
You enter a sell with a 5-pip stop and aim for 10 pips.
Price drops sharply to support, and you exit for +9 pips profit before DSL DMI starts turning green.
Strategy Tips
- Trade only when both indicators align to avoid false breakouts.
- Stick to high-volume hours for better price movement.
- Adjust stops and targets to pair volatility (major pairs vs. gold).
- Avoid trading just before major news releases.
- Test your broker’s spread on lower timeframes to ensure profit potential.
- Consider trailing your stop as soon as you’re in profit to lock gains.
Download Now
Download the “fatl-plusback-indicator.mq4” indicator for Metatrader 4
FAQ
What triggers a buy or sell signal in FATL Pulsback?
A buy signal occurs when a candlestick closes above the red moving average, while a sell signal occurs when it closes below.
Crossovers of the other three MAs provide additional confirmation.
How do the other three moving averages help?
The additional three moving averages serve to confirm the trend direction, filtering out false signals and improving trade accuracy.
Summary
The FATL Pulsback Indicator for MT4 is a comprehensive 4-moving-average crossover system that highlights reliable trend-following opportunities.
By focusing on the red moving average as the main trigger and using the other three for confirmation, traders can enter and exit trades with greater confidence.
This versatile indicator works on multiple timeframes and currency pairs, making it suitable for scalping, day trading, and swing trading.
When combined with trend confirmation tools or price action signals, it helps traders manage risk and capture high-probability market moves.


