About the Fibonacci Average Forex Indicator
The Fibonacci Average Indicator for MT4 displays the most important Fibonacci retracement levels over multiple days on the Forex chart.
It helps traders identify key areas where price is likely to pause or reverse, offering insight into market behavior for both trending and range-bound conditions.
This indicator is widely used by professional traders to buy dips in rising markets or sell rallies in declining markets.
By monitoring critical retracement levels, such as 38.2%, traders can plan entries and exits with higher confidence and improve overall trade timing.
It appears directly in the main MT4 chart window, providing a clean, actionable visual guide without cluttering the chart with additional indicators.
Free Download
Download the “fibonacci-average.mq4” indicator for MT4
Key Features
- Displays Fibonacci retracement levels across multiple trading days
- Highlights key levels such as 38.2%, 50%, and 61.8% for potential reversals
- Works on all currency pairs and timeframes
- Helps traders plan entries, exits, and stop loss levels
- Suitable for scalping, intraday, and swing trading
- Clear visual representation without overcrowding the chart
Indicator Chart
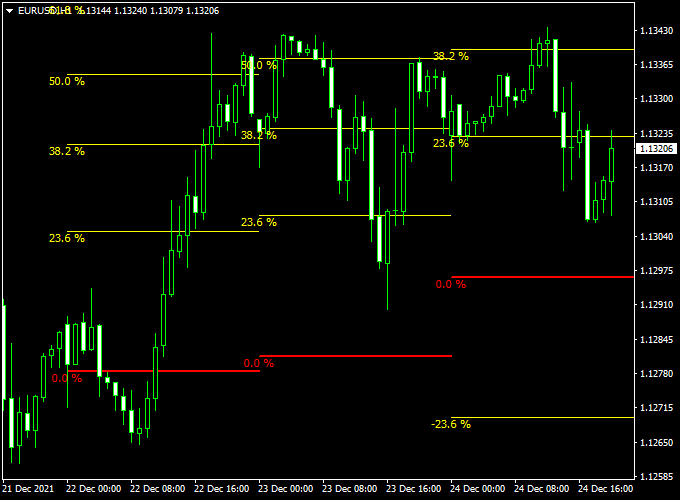
The chart example shows multiple Fibonacci retracement levels plotted over several days of price action.
Key levels, such as the popular 38.2% retracement, act as potential areas where price may pause or reverse.
Traders can use these levels to plan entries, exits, or observe where the market is likely to react during dips or rallies.

Guide to Trade with the Fibonacci Average Indicator
Buy Rules
- Wait for the price to approach a significant retracement level in an uptrend.
- Look for bullish reversal patterns, such as hammer candles or strong bullish closes.
- Enter a buy trade once the price confirms support at the retracement level.
Sell Rules
- Wait for the price to reach a retracement level in a downtrend.
- Observe bearish reversal patterns, such as shooting stars or rejection candles.
- Enter a sell trade when the price confirms resistance at the retracement level.
Stop Loss Placement
- For buy trades, place the stop loss just below the nearest retracement support level.
- For sell trades, place the stop loss just above the nearest retracement resistance level.
- Adjust stops according to market volatility and chosen timeframe.
Take Profit Targets
- Set take profit at the next Fibonacci level in the direction of the trend.
- Consider partial exits at intermediate retracement levels for safer profits.
- Use trailing stops to protect gains during strong trending moves.
Practical Trading Tips
- Combine the Fibonacci Average Indicator with trend indicators for higher confirmation.
- Monitor price reactions closely at key retracement levels for optimal entry timing.
- Be cautious when price moves sideways near retracement levels.
- Adjust visualization settings to keep the chart readability clear and concise.
MT4 Scalping Strategy: Fibonacci Average & XP Moving Average
This scalping strategy combines the Fibonacci Average Indicator MT4 and the XP Moving Average Indicator MT4 to identify precise entry points in the forex market.
The Fibonacci Average Indicator highlights key retracement levels for multiple days, with the 38.2% level being particularly important.
The XP Moving Average Indicator visually represents the trend with a green line for an uptrend and a red downtrend line.
Together, they provide a reliable framework for scalping on short-term timeframes, such as the 5-minute or 15-minute charts.
Buy Entry Rules
- The XP Moving Average line is green, confirming an uptrend.
- Enter a buy trade when the price reaches the 38.2% Fibonacci retracement level in the uptrend.
- Set stop loss below the recent swing low or just under the 38.2% retracement level.
- Take profit at the first Fibonacci resistance level (R1) or higher, depending on market conditions.
Sell Entry Rules
- The XP Moving Average line is red, confirming a downtrend.
- Enter a sell trade when the price reaches the 38.2% Fibonacci retracement level in the downtrend.
- Set stop loss above the recent swing high or just above the 38.2% retracement level.
- Take profit at the first Fibonacci support level (S1) or lower, depending on market conditions.
Advantages
- Precision entries at key Fibonacci levels reduce risk and improve reward potential.
- Combining trend confirmation with retracement levels increases the probability of success.
- Suitable for scalping on short-term charts, including 5-minute and 15-minute timeframes.
- Easy to visualize market direction using the XP Moving Average indicator.
Drawbacks
- Requires careful monitoring and fast execution, which may not suit all traders.
- Not foolproof; proper risk management is essential to avoid losses.
Case Study 1: AUD/USD 5-Minute Chart
On the AUD/USD 5-minute chart, the XP Moving Average turned green, indicating an uptrend.
The price pulled back to the 38.2% Fibonacci retracement level, providing a buy entry signal.
A trade was entered at this level, with a stop loss below the swing low.
The price quickly moved upward, reaching the first Fibonacci resistance level (R1) for a profit of approximately 18 pips.
Case Study 2: USD/CHF 15-Minute Chart
On the USD/CHF 15-minute chart, the XP Moving Average turned red, confirming a downtrend.
The price retraced to the 38.2% Fibonacci level, offering a sell entry opportunity.
A sell position was opened with a stop loss above the recent swing high.
The price fell to the first Fibonacci support level (S1), yielding a profit of around 22 pips.
Strategy Tips
- Use this strategy during high volatility periods for quicker price movement.
- Combine with other indicators or price action patterns for additional confirmation.
- Backtest on multiple currency pairs to evaluate performance under different market conditions.
- Stick to stop loss and take profit levels to maintain disciplined risk management.
Download Now
Download the “fibonacci-average.mq4” indicator for Metatrader 4
FAQ
Which retracement levels are most important?
Traders often watch the 38.2%, 50%, and 61.8% retracement levels, as these are common areas where price tends to react or reverse.
Can this indicator be combined with other tools?
Yes. It works well alongside trend, momentum, or volume indicators to confirm potential entries and exits.
Is it suitable for beginner traders?
Yes. The visual display of retracement levels provides clear guidance for beginners, while professional traders can use it to fine-tune entry and exit strategies.
Summary
The Fibonacci Average Indicator for MT4 is a powerful tool for tracking key retracement levels over multiple days.
It provides traders with a clear framework for identifying potential support and resistance areas, allowing for more precise trade planning.
By combining this indicator with other confirmation tools, traders can increase trade accuracy, manage risk effectively, and confidently buy dips or sell rallies in trending markets.


