
The Fibonacci Forex trading system indicator for MT4 is based on the Fibonacci strategy and offers a complete trading solution.
The indicator does all the hard work for you and provides the suggested entry level, stop loss, and 3 take profit levels.
Forex trading can’t be easier than this!
The indicator works for any currency pair of your preference.
Free Download
Download the “autofibophenomenon.ex4” indicator for MT4
Indicator Example Chart (EUR/USD M5)
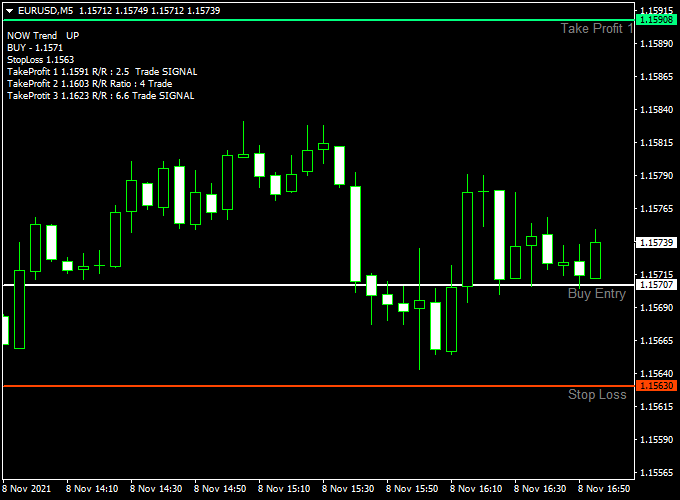
How to trade with it (example)?
Open a long trade whenever the indicator plots “BUY” on the chart. Use the suggested stop loss and take profit levels for the buy trade.
Open a short trade whenever the indicator plots “SELL” on the chart. Use the suggested stop loss and take profit levels for the sell trade.
Naturally, feel free to use your own favorite trading strategy to open and close trades with the Fibonacci Forex trading system indicator.
Indicator Specifications
Trading Platform: Developed for Metatrader 4 (MT4)
Currency pairs: Works for any pair
Time frames: Works for any time frame
Input Parameters: Alerts, color settings & style
Indicator type: Forex system
Repaint? Does not repaint the entry, stop loss, and take profit levels.
Download Now
Download the “autofibophenomenon.ex4” indicator for Metatrader 4
Fibonacci Trading System + SMC Market Insights Strategy for MT4
This strategy combines the strengths of the Fibonacci Forex Trading System Indicator and the SMC Forex Market Insights Indicator to deliver a structured and smart approach to market entries.
By fusing Fibonacci-based levels with Smart Money Concepts (SMC), traders can identify high-probability trades where institutional interest aligns with key price zones.
What Is This Strategy About?
This is a price action-based strategy designed to follow institutional order flow.
The Fibonacci system offers structured support and resistance levels derived from retracements and extensions, while the SMC Market Insights indicator identifies order blocks, liquidity zones, and smart money manipulation.
The strategy is ideal for swing traders and intraday traders who want to trade with the big players, not against them.
How the Indicators Work Together
1. Fibonacci Forex Trading System
This indicator plots real-time Fibonacci retracement and extension levels on the chart.
These levels are commonly respected by institutional traders and can act as reversal or breakout points.
It provides clear visual zones to plan entries, exits, and stop-loss placements.
2. SMC Forex Market Insights
The SMC indicator displays institutional concepts such as order blocks, breaker blocks, mitigation zones, and liquidity sweeps.
It highlights where banks and large institutions are likely placing their trades and stops, allowing retail traders to align with the actual market flow.
Buy Rules
- Price should approach a key Fibonacci retracement zone (e.g., 50% or 61.8%) after a bullish move.
- Look for a Bullish Order Block or Mitigation Zone from the SMC Indicator to appear near that level.
- Wait for bullish confirmation (bullish engulfing candle or break of structure) inside the SMC zone.
- Enter long at the close of the confirmation candle.
- Stop loss below the order block or 78.6% Fib level.
- Target the 100% or 161.8% Fibonacci extension level, or the next liquidity pool shown by the SMC indicator.
Sell Rules
- Price should approach a Fibonacci resistance zone (e.g., 50% or 61.8%) after a bearish move.
- Look for a Bearish Order Block or Liquidity Sweep at or near the Fibonacci level.
- Wait for a bearish confirmation (bearish engulfing candle or break of minor bullish structure).
- Enter shortly after confirmation.
- Stop loss above the order block or 78.6% Fib resistance.
- Target the 0% level or the next low/liquidity sweep marked by the SMC indicator.
Advantages of the Strategy
- High-Probability Entries: Combines technical structure with institutional activity for optimal timing.
- Smart Money Focus: The SMC indicator avoids retail traps by following real market intent.
- Risk Management Friendly: Uses Fibonacci zones for structured stop placement and logical targets.
- Works Across Timeframes: Ideal for M15–H4 swing and intraday setups.
Drawbacks and Considerations
- The system requires patience—wait for confluence between Fibonacci and SMC zones.
- News events can disrupt institutional patterns—avoid trading around major releases.
- False signals may occur in choppy or low-volume markets—stick to active sessions.
Conclusion
This hybrid strategy, using the Fibonacci Forex Trading System and SMC Forex Market Insights Indicator, gives traders the edge of combining traditional price levels with smart money footprints.
It empowers you to trade with precision and confidence by aligning your entries with institutional liquidity and key Fibonacci retracements.
Add it to your MT4 toolkit to spot high-probability opportunities the smart way.
Usage:
Works for any trade style: scalping, day trading, and swing trading.
The Fibonacci Forex trading system is complete; there’s no need to use additional technical indicators.
Installation:
Open the Metatrader 4 platform
From the top menu, click on “File”
Then click on “Open Data Folder”
Then double click with your mouse button on “MQL4”
Now double click on “Indicators”
Paste the autofibophenomenon.ex4 indicator in the Indicators folder.
Finally restart the MT4 platform and attach the indicator to any chart.
How to remove the indicator?
Click with your right mouse button in the chart with the indicator attached onto it.
Select “Indicator List” from the drop down menu.
Select the indicator and press delete.
How to edit the indicator’s inputs and parameters?
Right click with your mouse button in the chart with the indicator attached onto it.
From the drop down menu, click on indicators list.
Select the indicator from the list and press edit.
Now you can edit the indicator.
Finally, press the OK button to save the updated configuration.


